CESSI IISER KOLKATA OUTREACH INITIATIVE ON COVID19
The coronavirus pandemic is unparalleled in modern human history. Its impact has spread far and wide across the world and through all sections of the society. India has not been spared and our daily numbers of CoViD19 infections are still rising. Our country is in the midst of an unprecedented lockdown which has had disproportionate consequences on people with varied economic backgrounds. New information, myths, hoaxes and claims bombard our collective consciousness every day. In these challenging times, research geared towards understanding different aspects of the novel coronavirus virus SARS-CoV-2, creation of scientific awareness about the disease, and effective science communication that may inform public behaviour and guide policy, are crucial towards mitigating the adverse impacts of this pandemic.
The Center of Excellence in Space Sciences India (CESSI), IISER Kolkata have utilized their in-house modelling and data analytics capabilities to create resources intended for spreading scientific awareness about the pandemic among the general public and guiding future policies relating to the same. The resources available here are based on the CESSI-nCoV-SEIRD model which has been optimized for the Indian context at IISER Kolkata, data analysis of India specific and some global data on the progress of the pandemic, and informational graphics and social media messages created by the Indian Scientists’ Response to CoViD19 (ISRC) group – to which IISER Kolkata scientists have contributed.
Further details on the epidemiology model developed at CESSI can be found in the "Model" section. India-specific information on the disease progression and critical parameters characterizing the progression of the pandemic can be found in the "Data Analytics" section. Socio-scientific awareness materials can be found in the "Public Outreach" section.
We have also analyzed the COVID19 progression for different Indian states and cities which can be found below by selecting the name of the state or the city.
Important Note: All model outputs depend on certain starting assumptions and governing parameters that have to be reasonably constrained by observations. For the coronavirus pandemic these are still early days and most observational data are under-sampled. Our simulation set-up, modelling assumptions and governing parameters would be updated as and when more reliable constraints are available and a better physical understanding is achieved. Therefore, we advise that any policy actions based on our research should lay more emphasis on the qualitative trends implied in our simulations rather than actual numbers.
Spotlight India
In this section, we highlight some issues that are very relevant to the coronavirus pandemic in the Indian context. We tackle some outstanding questions and provide model-based solutions that can guide public policy and catalyze socio-scientific awareness. These answers are backed by our model predictions and data analysis of the observed trends in India.
1. Is the Indian national lockdown necessary; what would have happened if there were no lockdown?
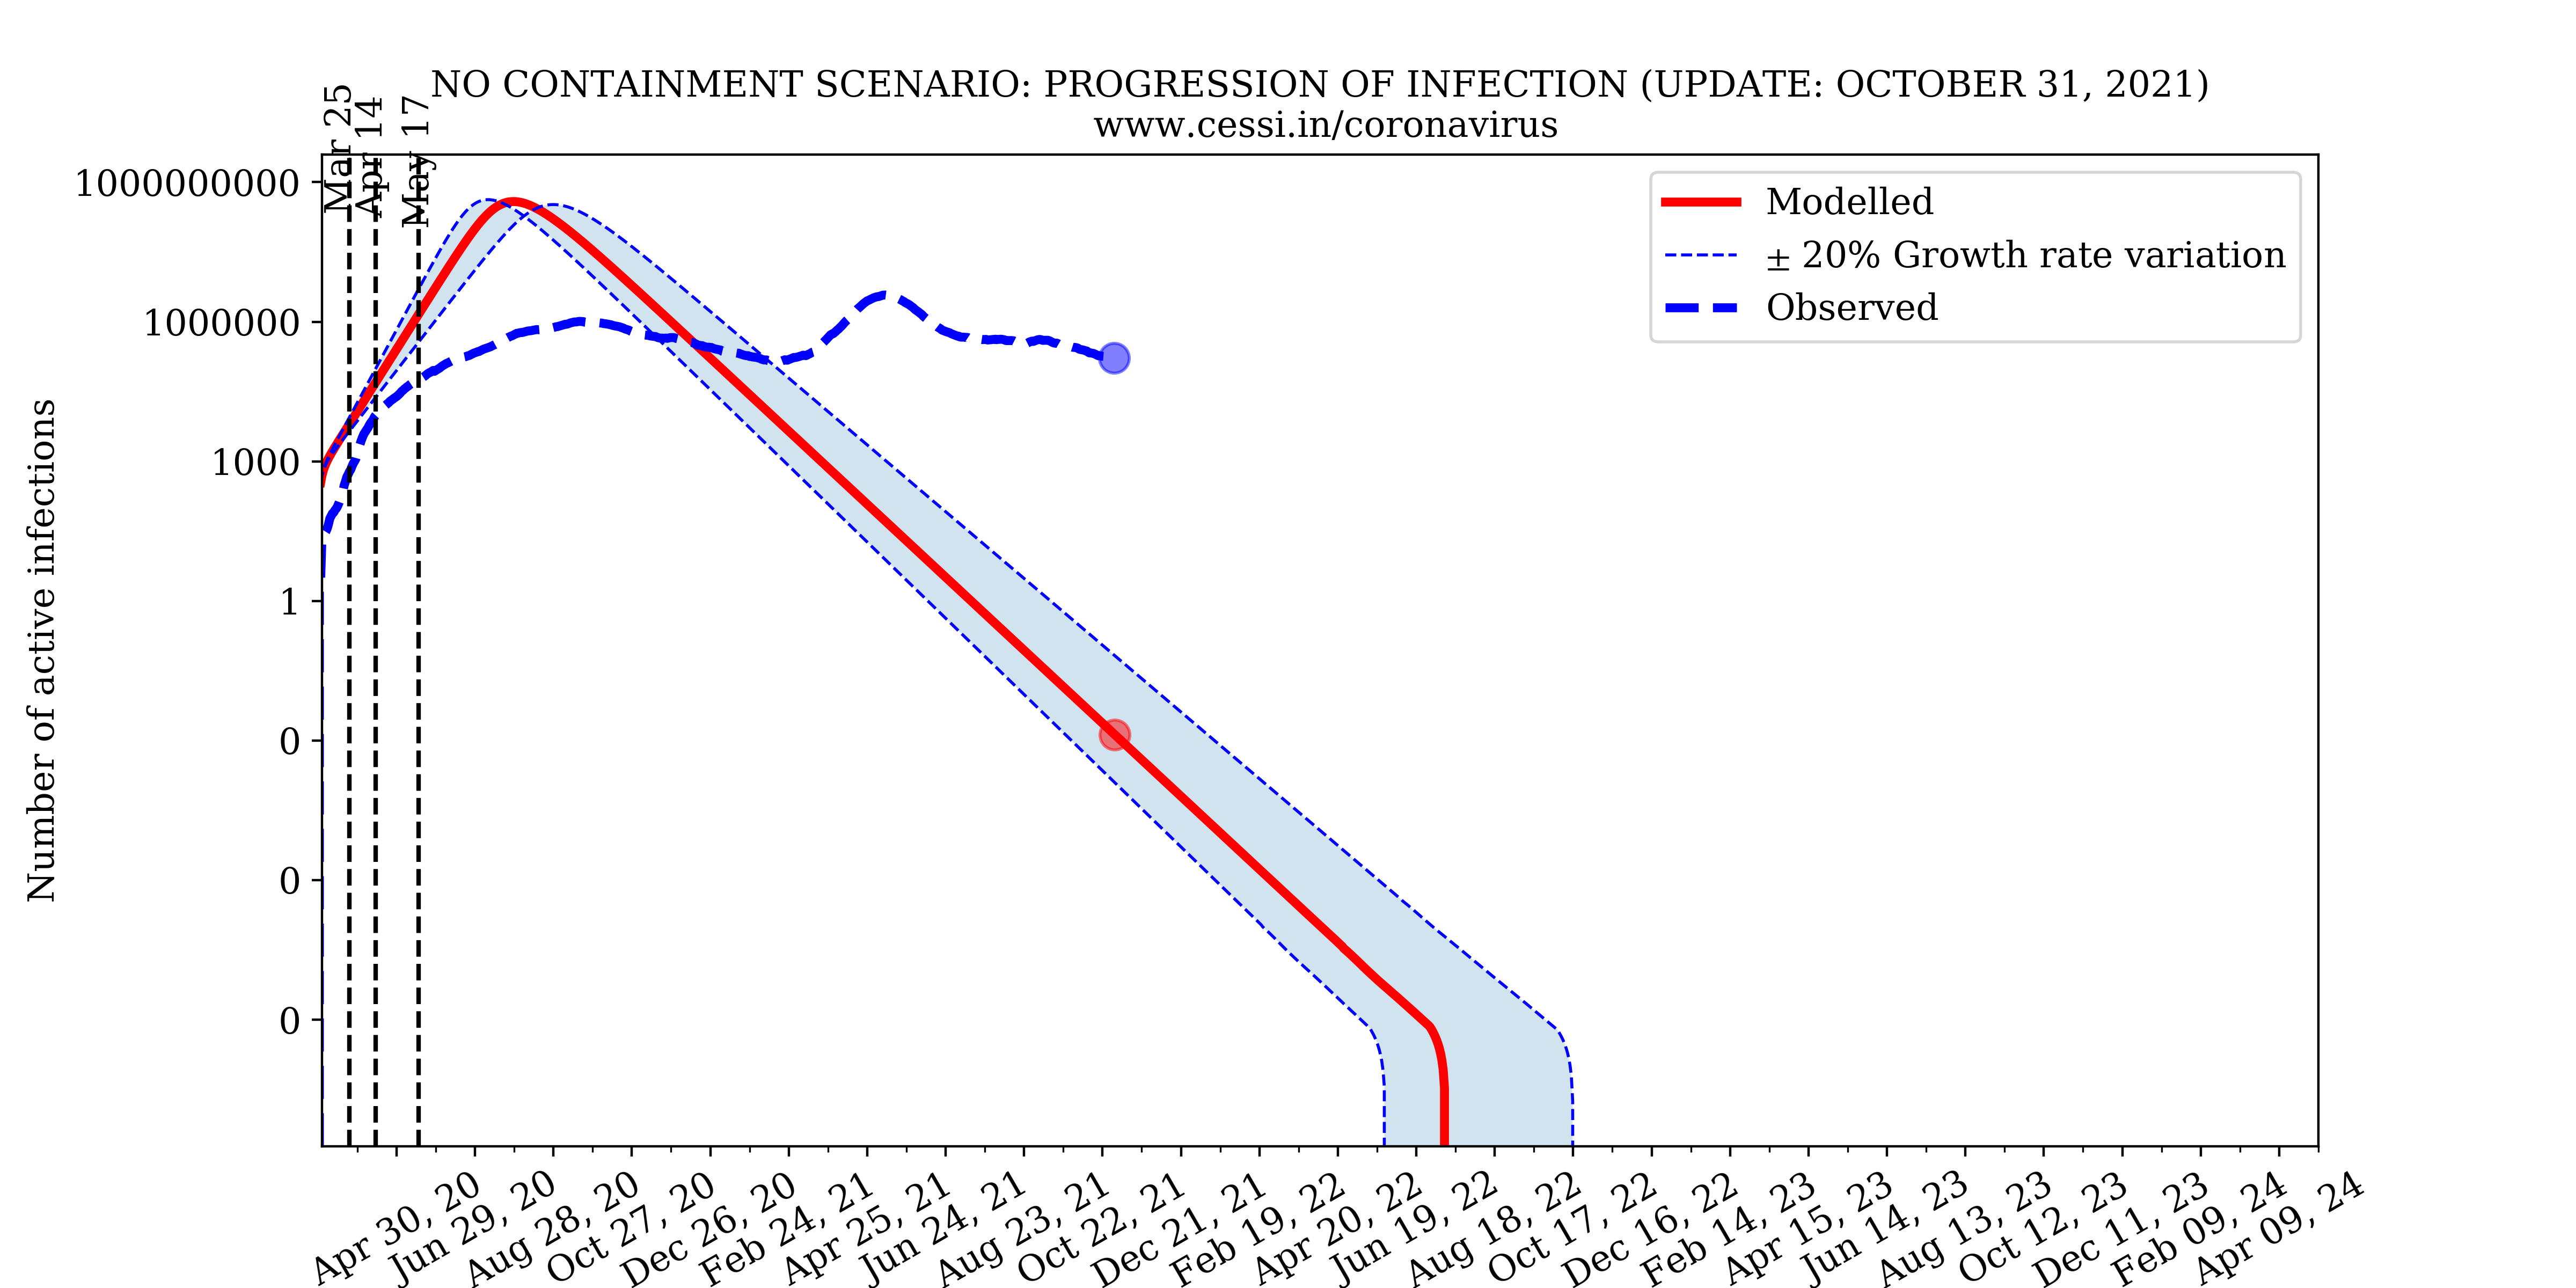
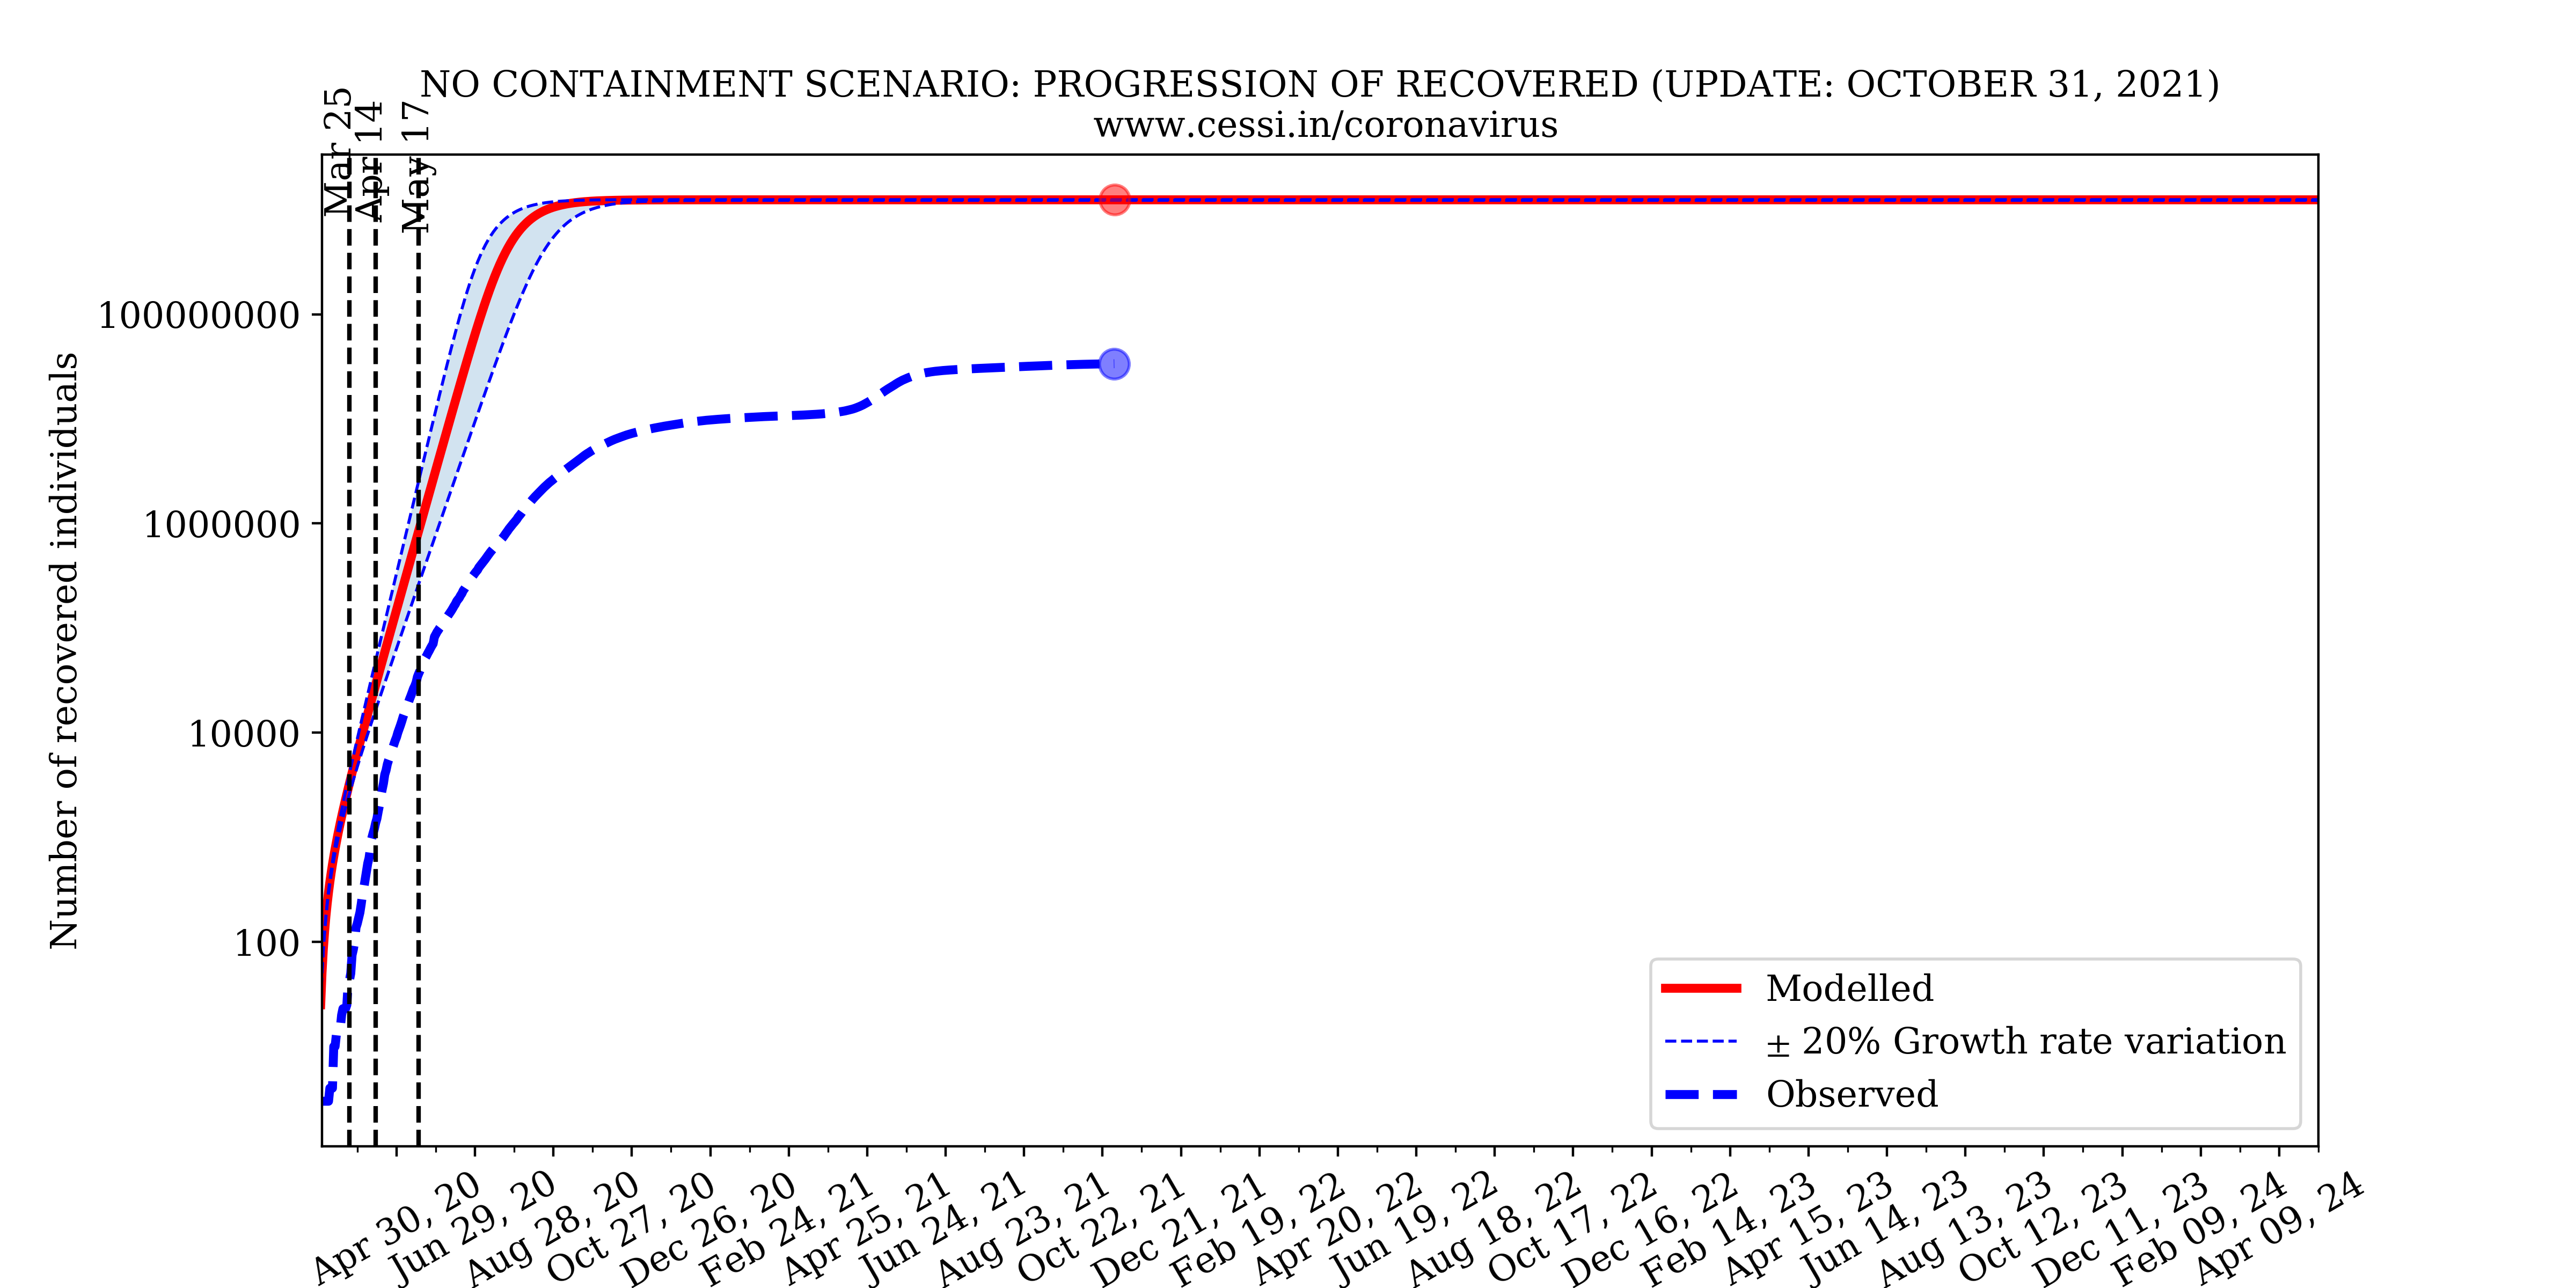
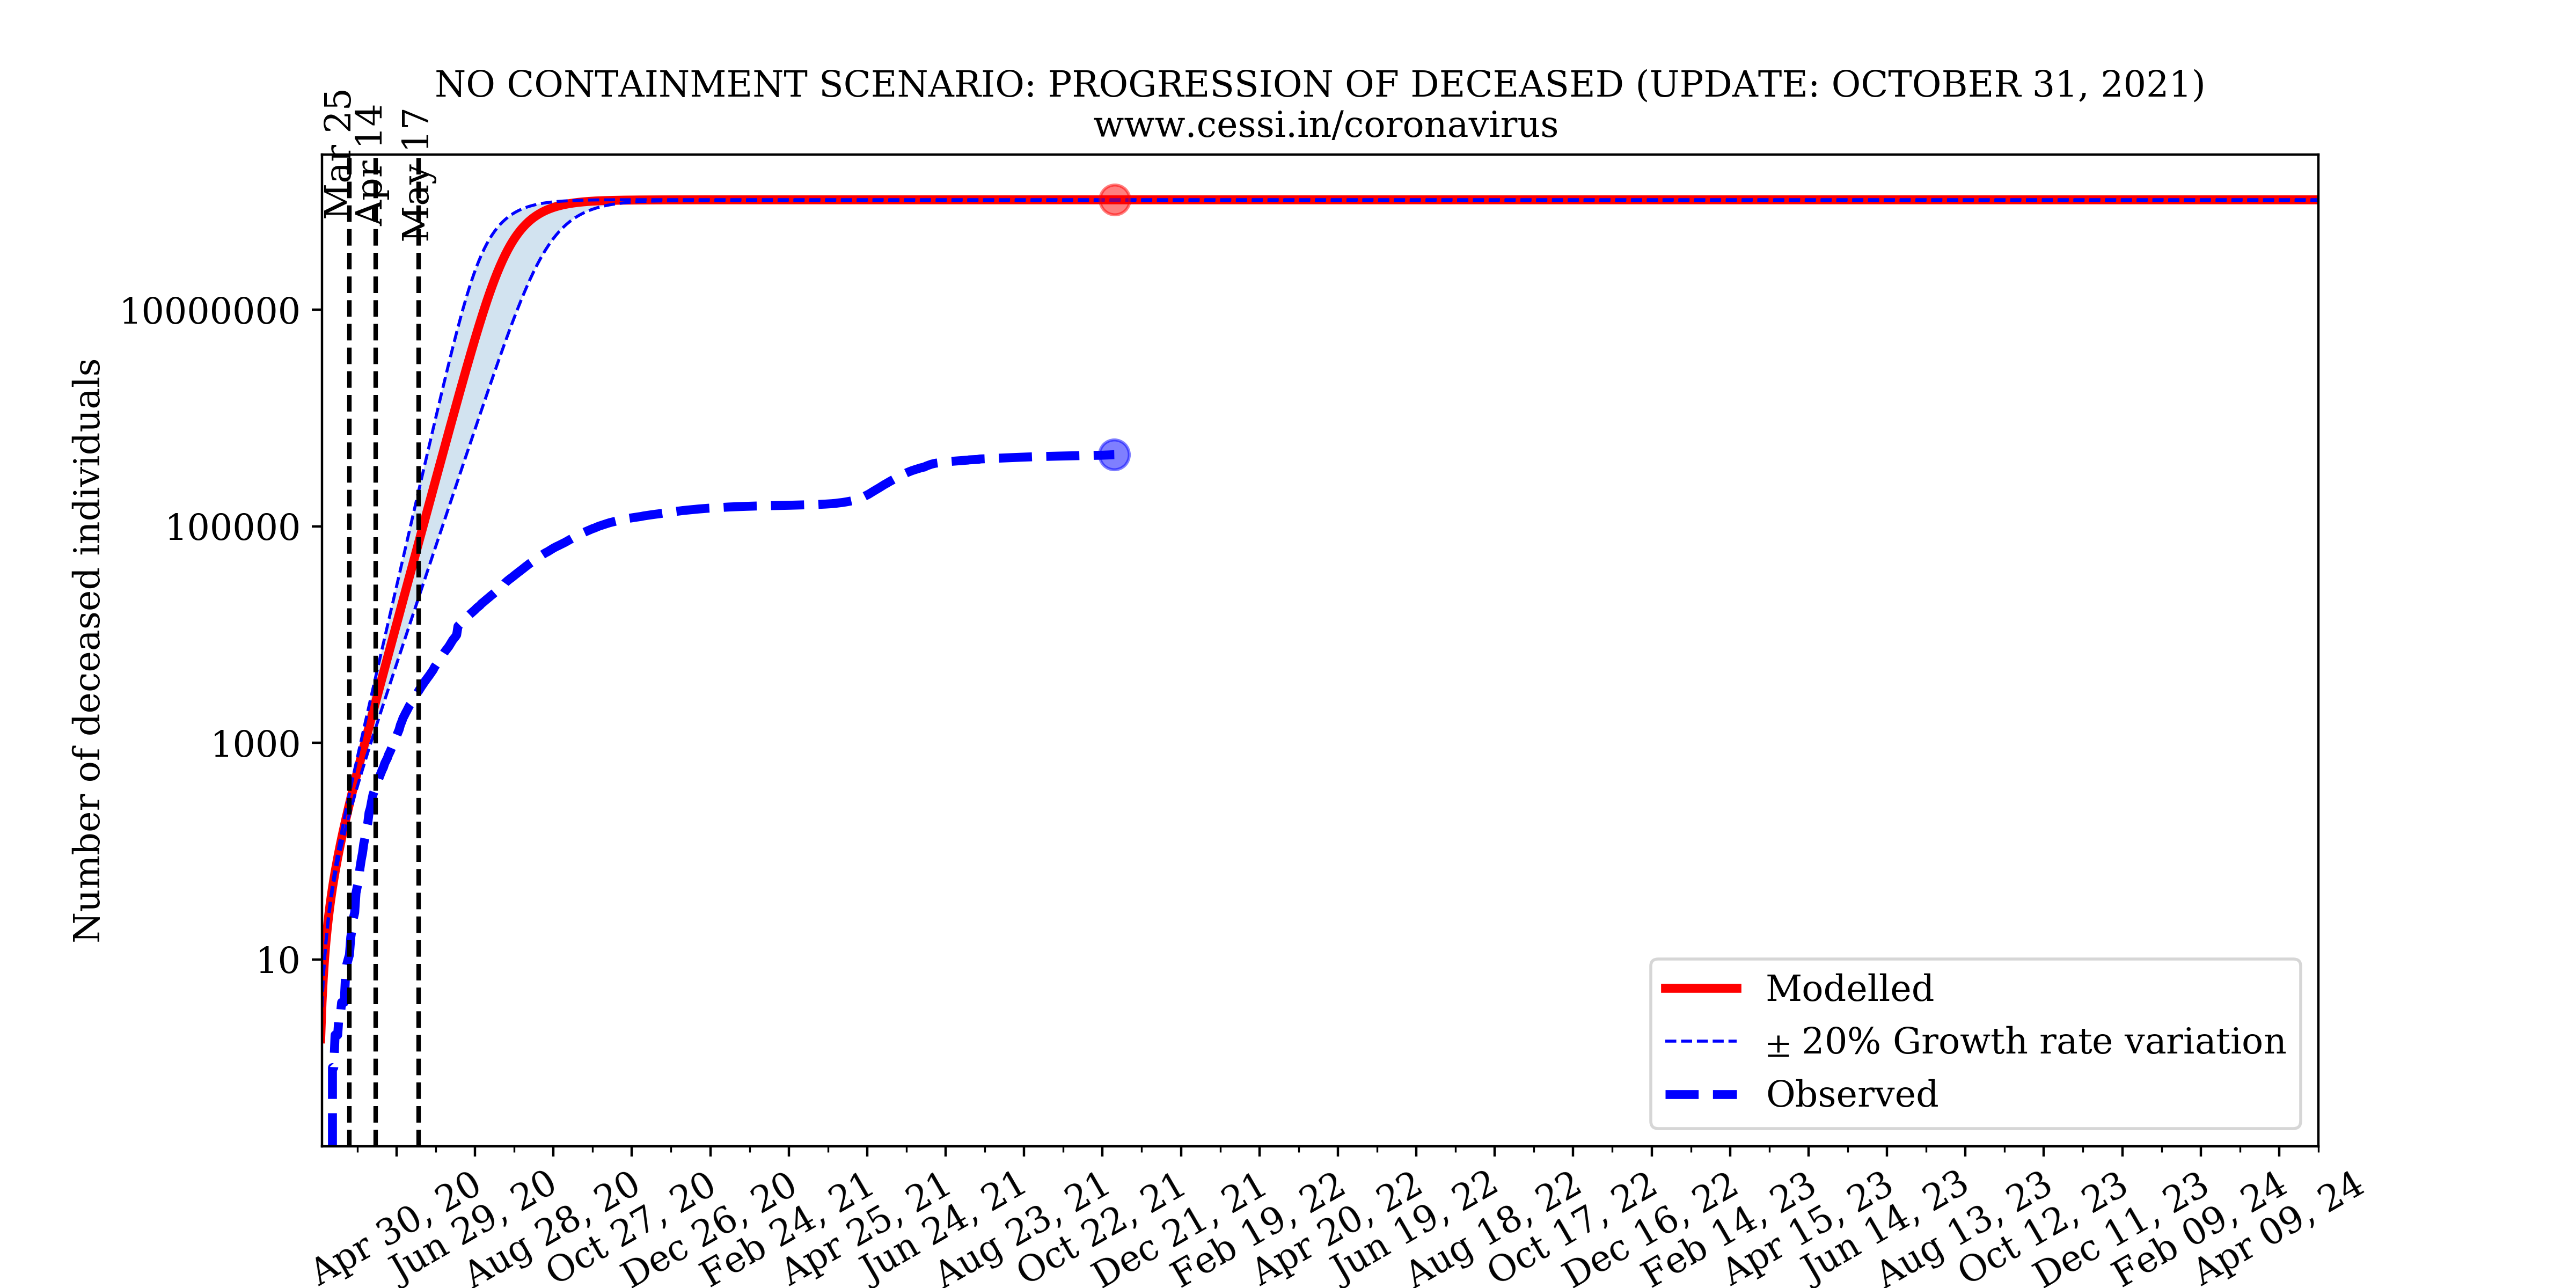
The above simulation based on our epidemiological model shows the progression of the coronavirus pandemic in India under a no-containment scenario. The results of this simulation indicates that the number of infected and deceased individuals would have risen rapidly and could have been unacceptably large. Eventually, almost all the individuals susceptible to the disease (in our simulation assumed to be the population of India) could have become infected. Note that we do not include herd immunity in our model; however, even if herd immunity was included, the number of infected individuals would likely have been 60% of the whole Indian population! We could have had the highest number of coronavirus deaths in the world. Our health care infrastructure and hospitals would not have been able to deal with this free-flowing pandemic in the no-containment scenario. A containment slows down the growth rate of the disease leading to more recoveries and less deaths in the long run. A containment also flattens the curve of infection implying a lesser number of infected individuals at any point in time; this allows our healthcare facilities to cope with the pandemic and buys crucial time for formulating strategic plans to deal with the disease. This simulation clearly demonstrates the catastrophic scenario that the Indian national lockdown aims to avoid.
2. How efficient is the Indian national lockdown?
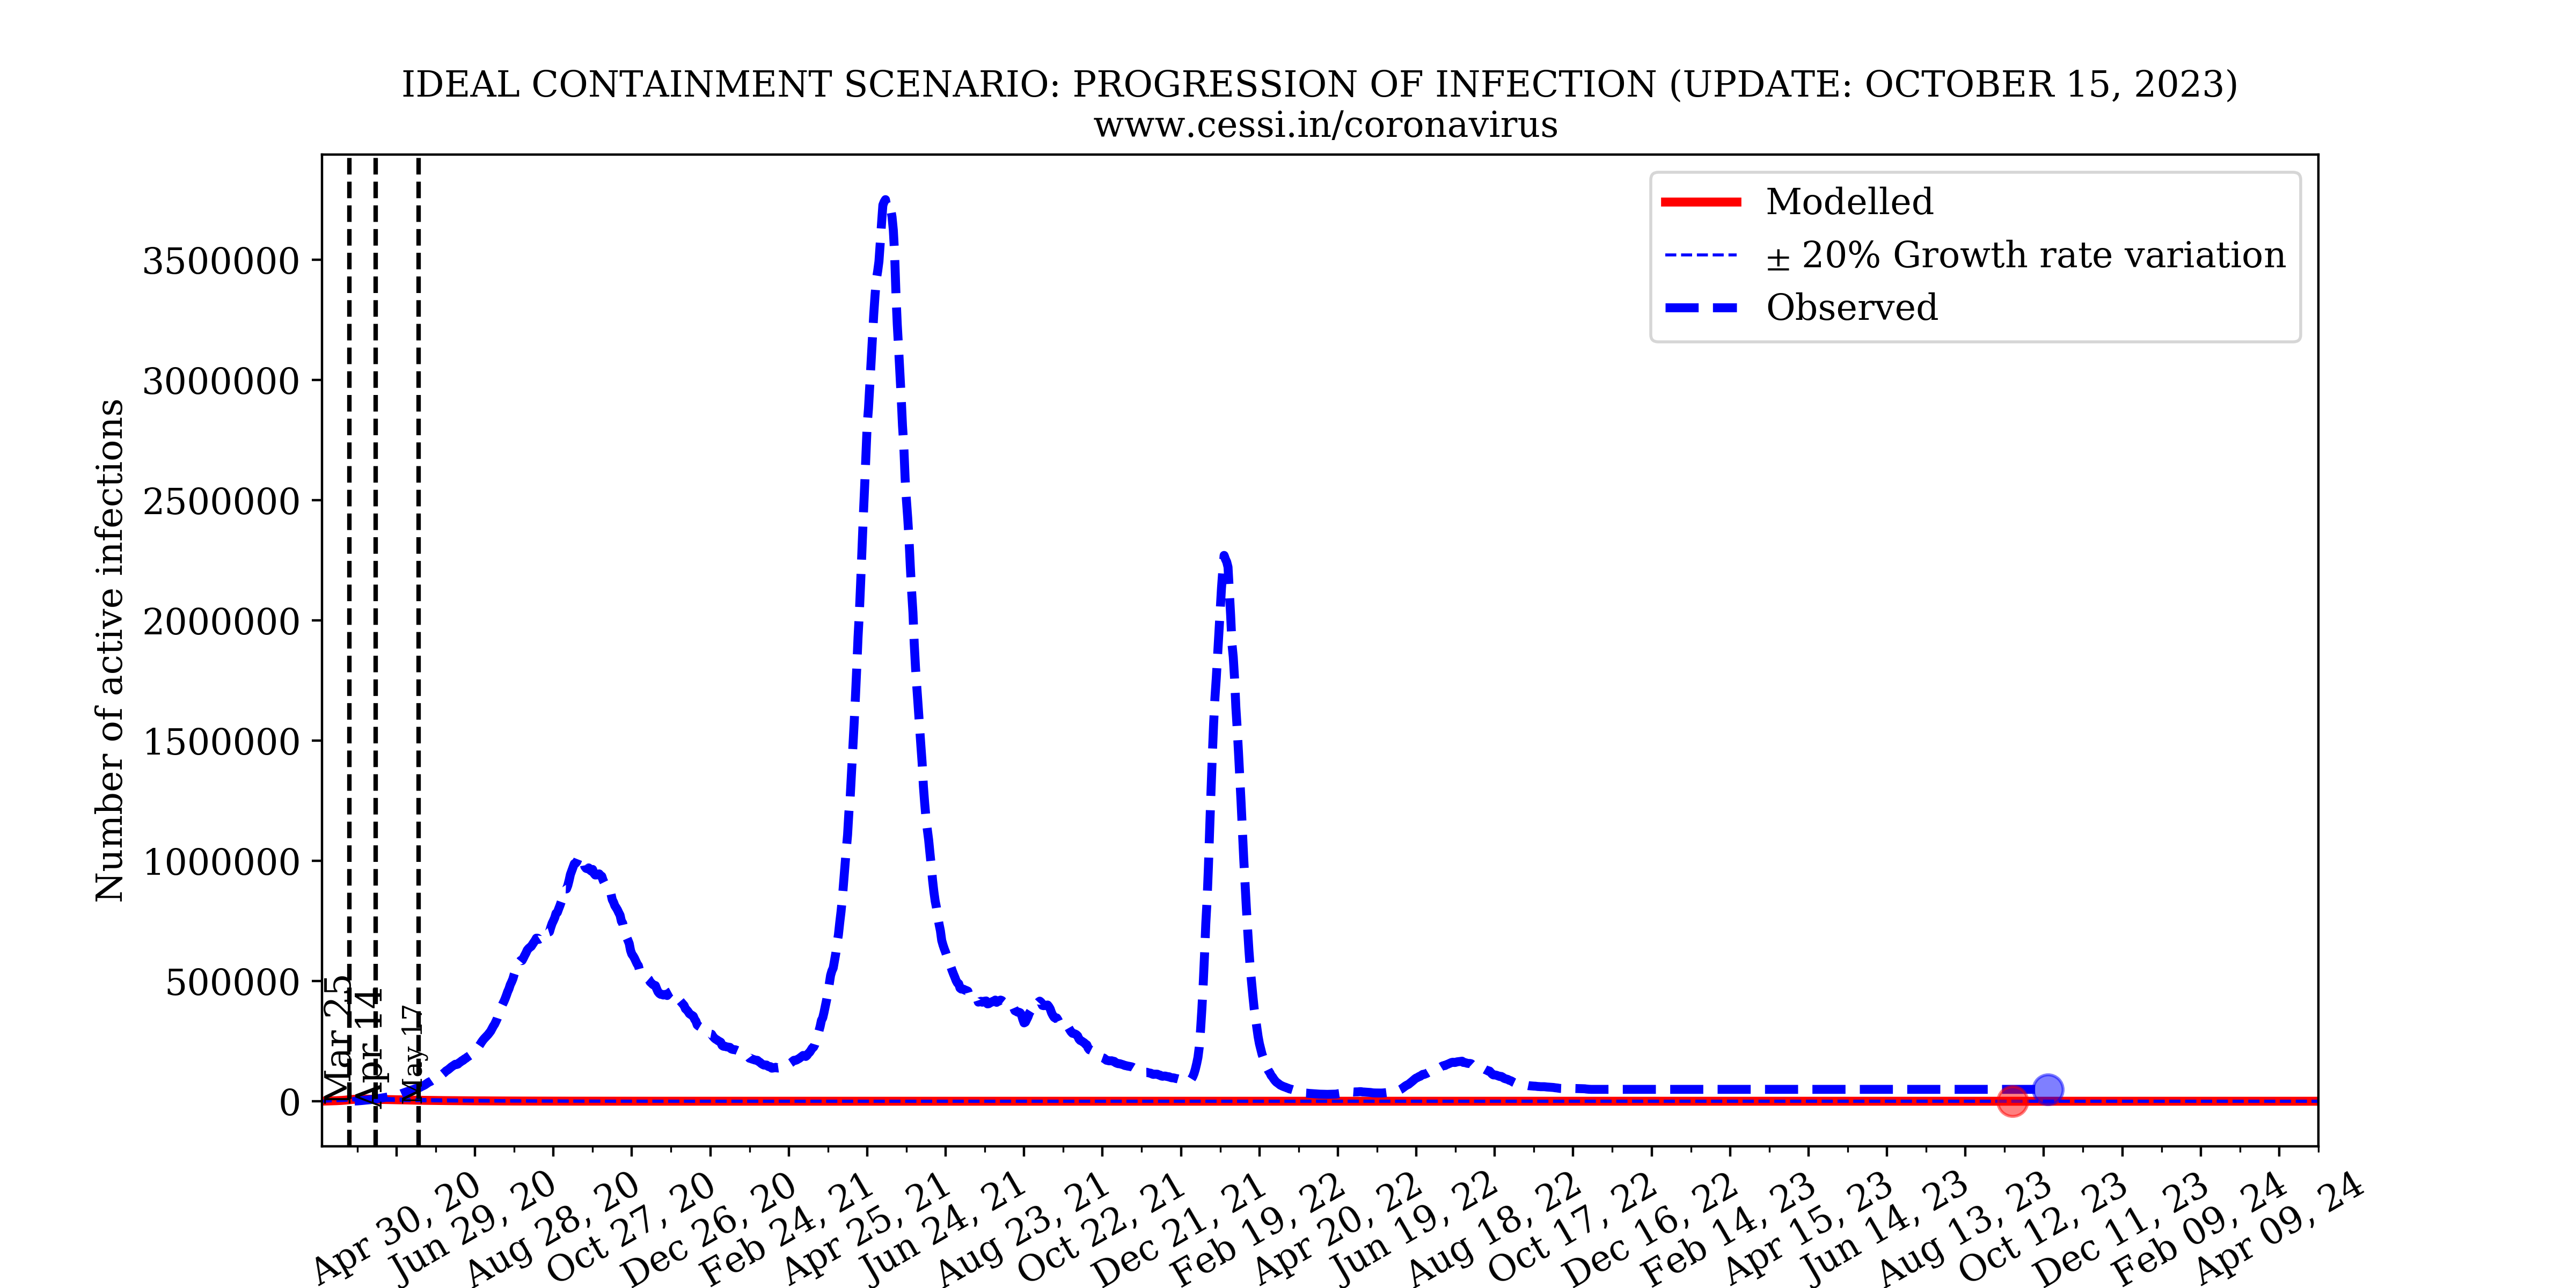
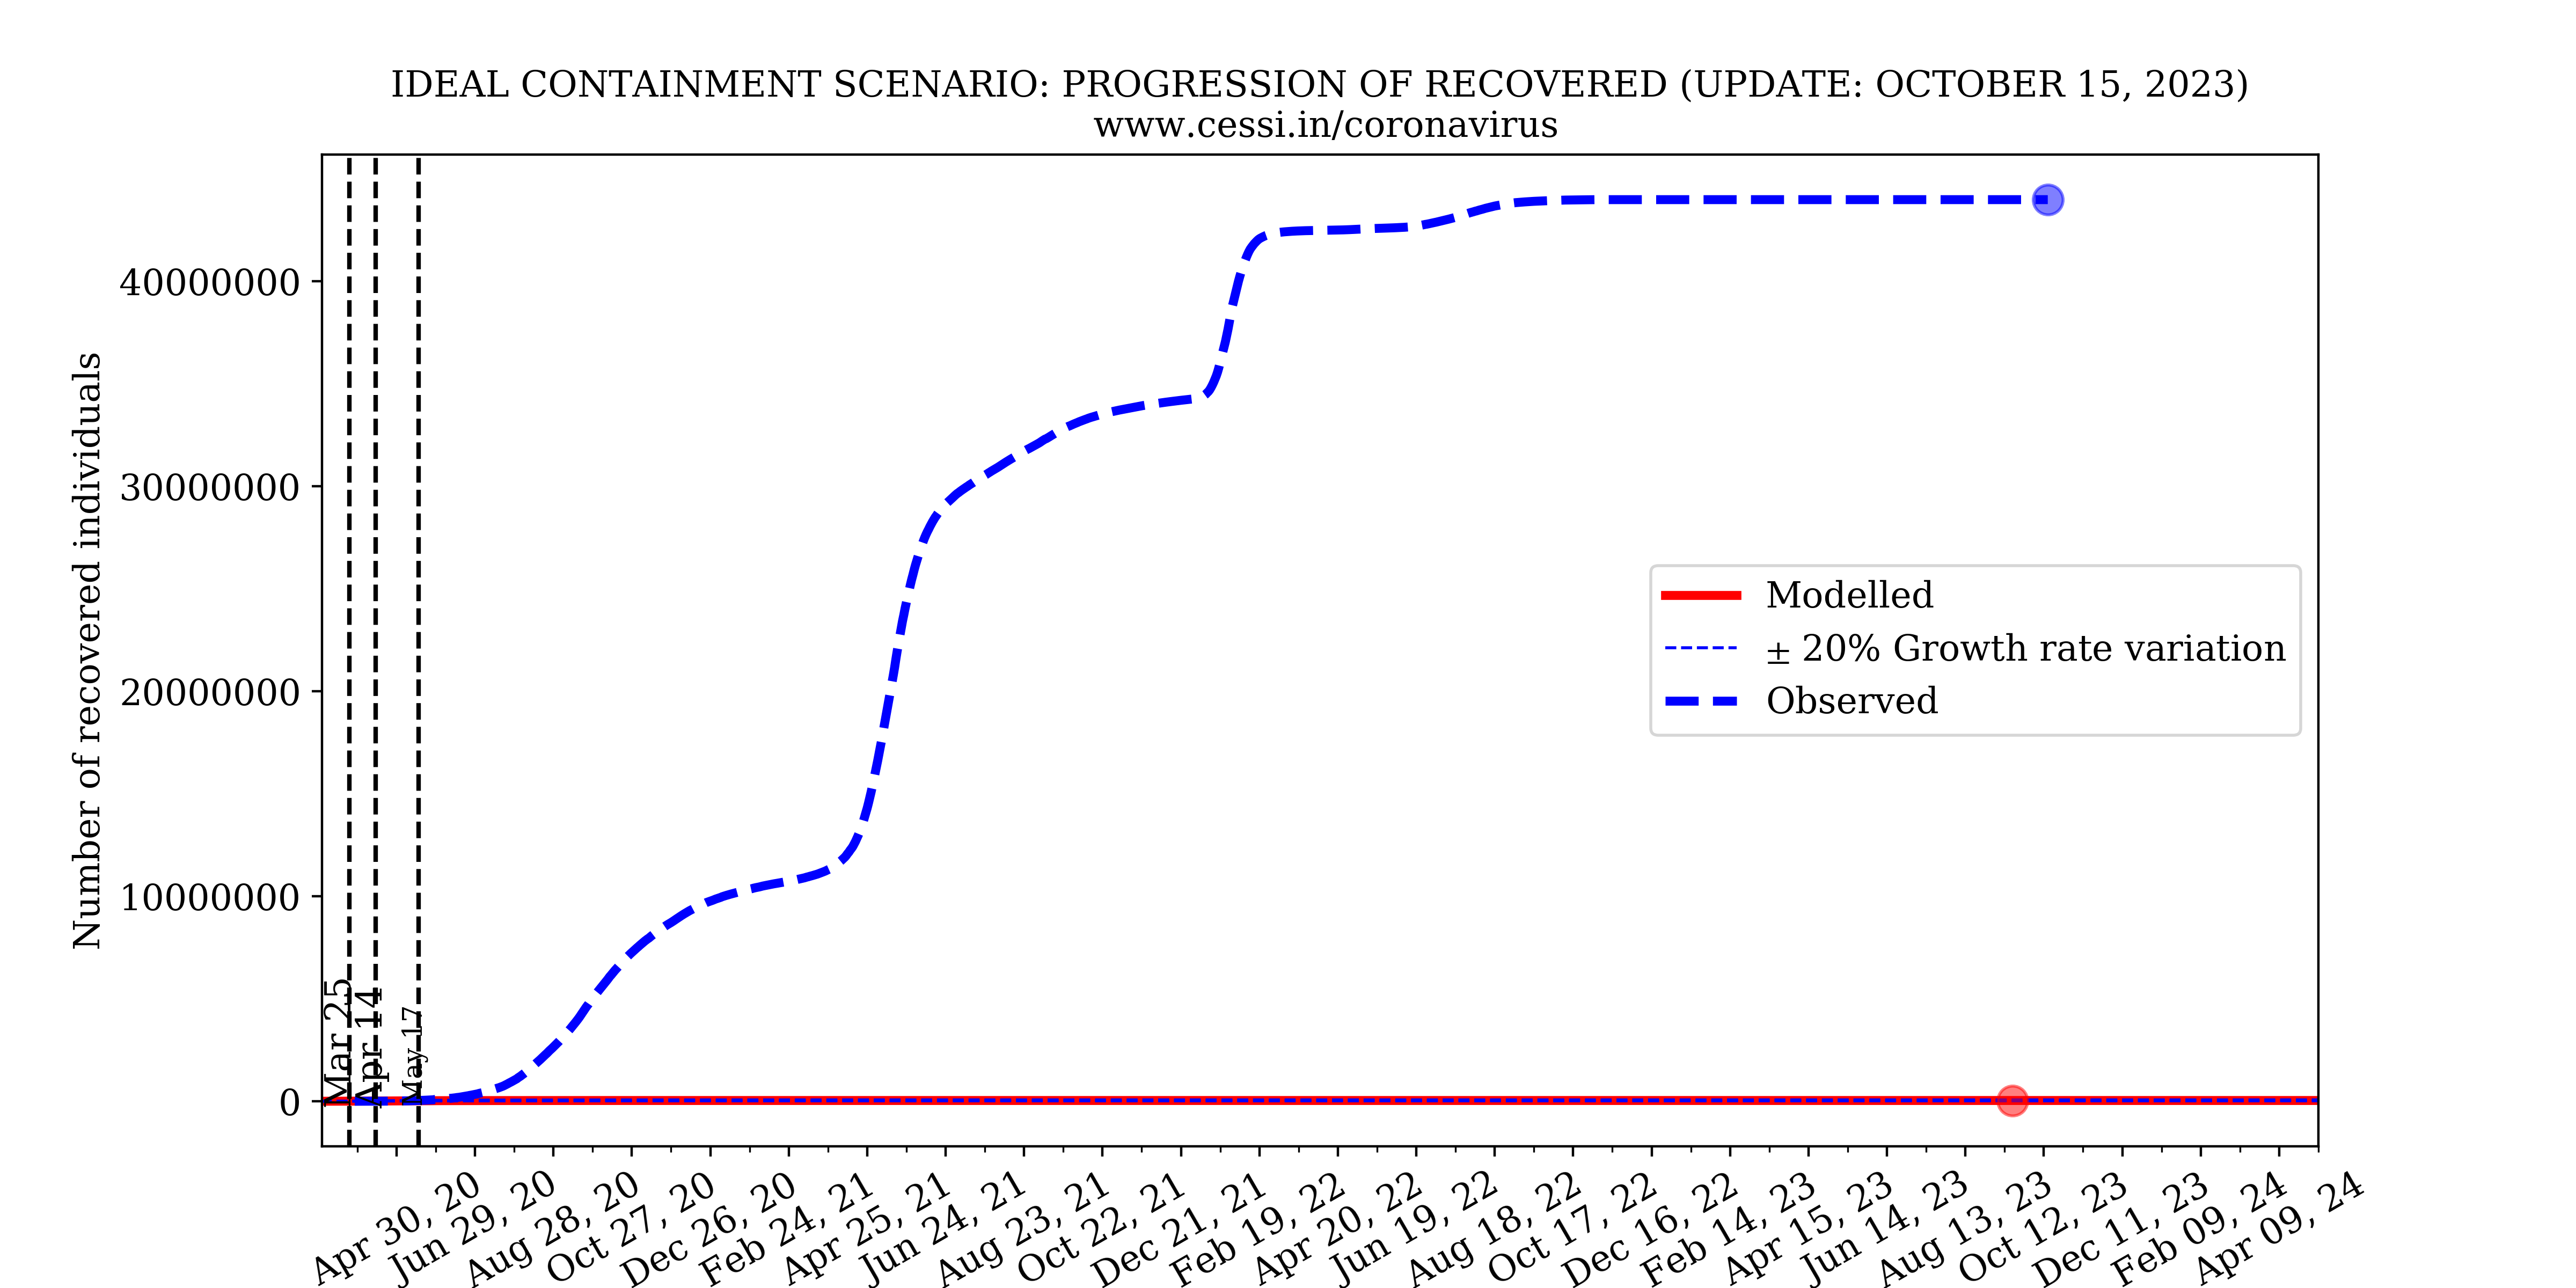
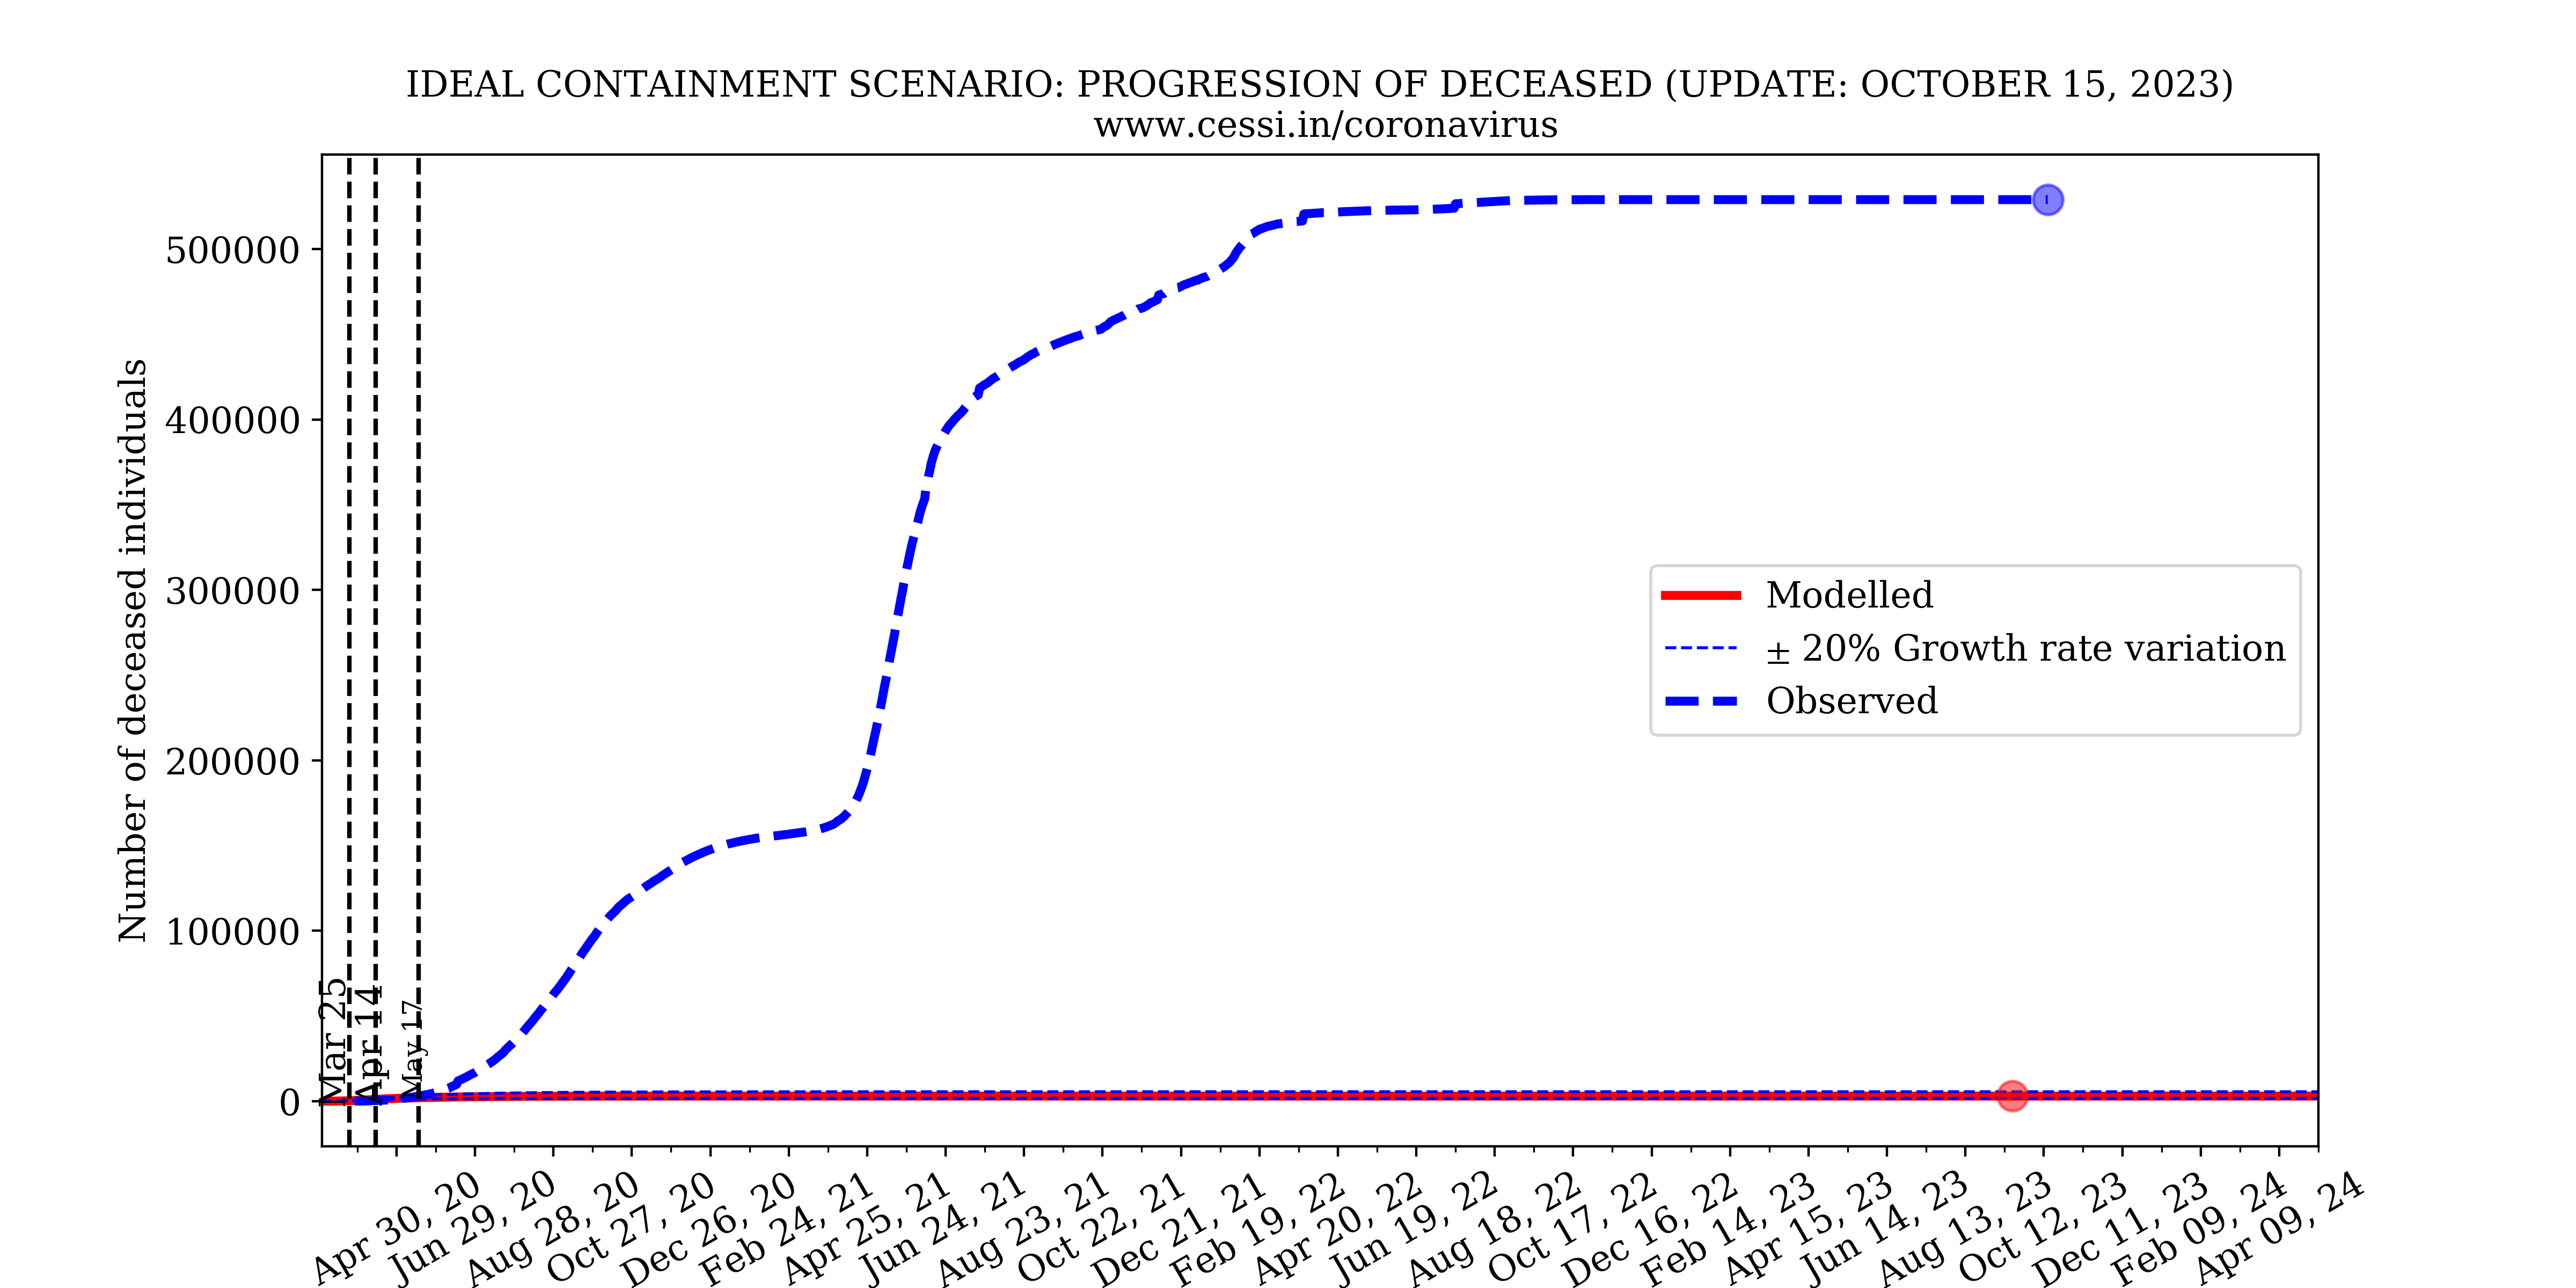
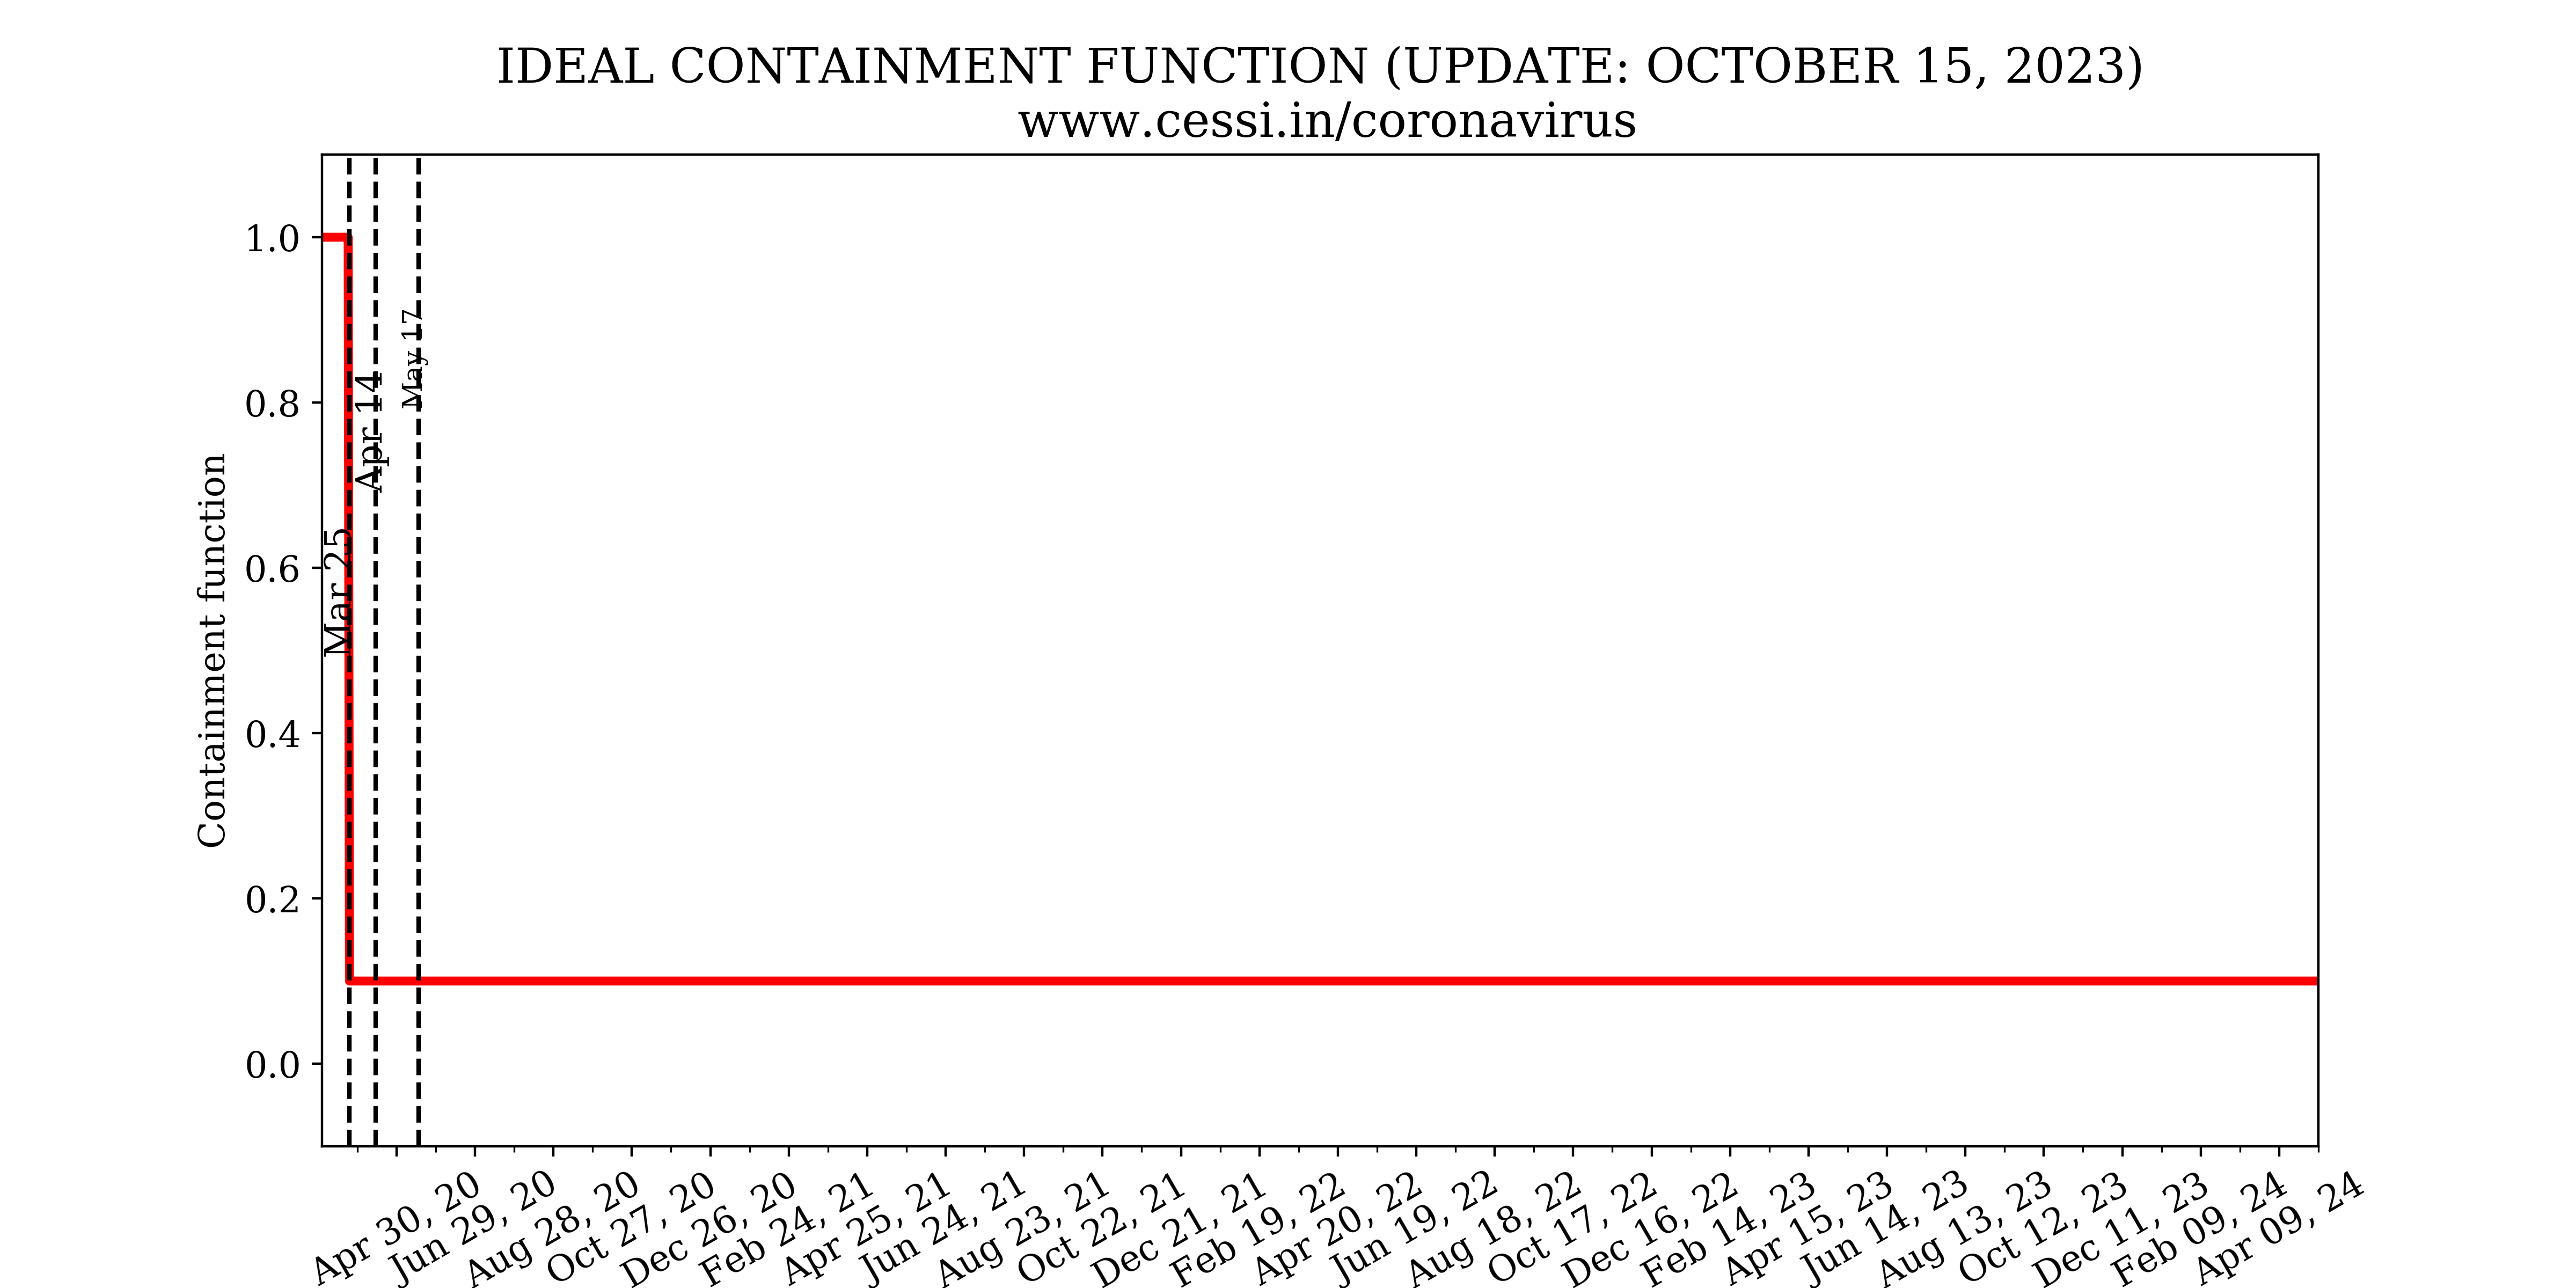
While the containment has been undoubtedly effective in lowering the growth rate of the disease, it has not been ideal. In the above simulation we implement a "close to ideal" containment with the epidemic growth rate reduced to 10% of the originally assumed unrestrained growth rate. For this nearly ideal containment scenario, the simulation indicates that the active infected individuals would have been between 5000 and 15000 with the pandemic peaking in late March. However, this does not agree with the number of observed active infections which has already surpassed this containment scenario by a significant margin and is still increasing. The total number of deaths in an ideal containment scenario would be anywhere between 1500 and 5500, taking reasonable uncertainties into account. Nonetheless, the rapidly increasing mismatch between the observed and simulated active infections indicates that the Indian national containment is not absolutely perfect. An imperfect containment is to be expected when one takes into account human behavioral traits and random events which disproportionately contribute to “super-spreading” the disease.
3. What is the simulated most-likely-scenario of novel coronavirus progression in India; what does this India-specific simulation tell us about the national containment efficiency and eventual numbers of affected individuals?
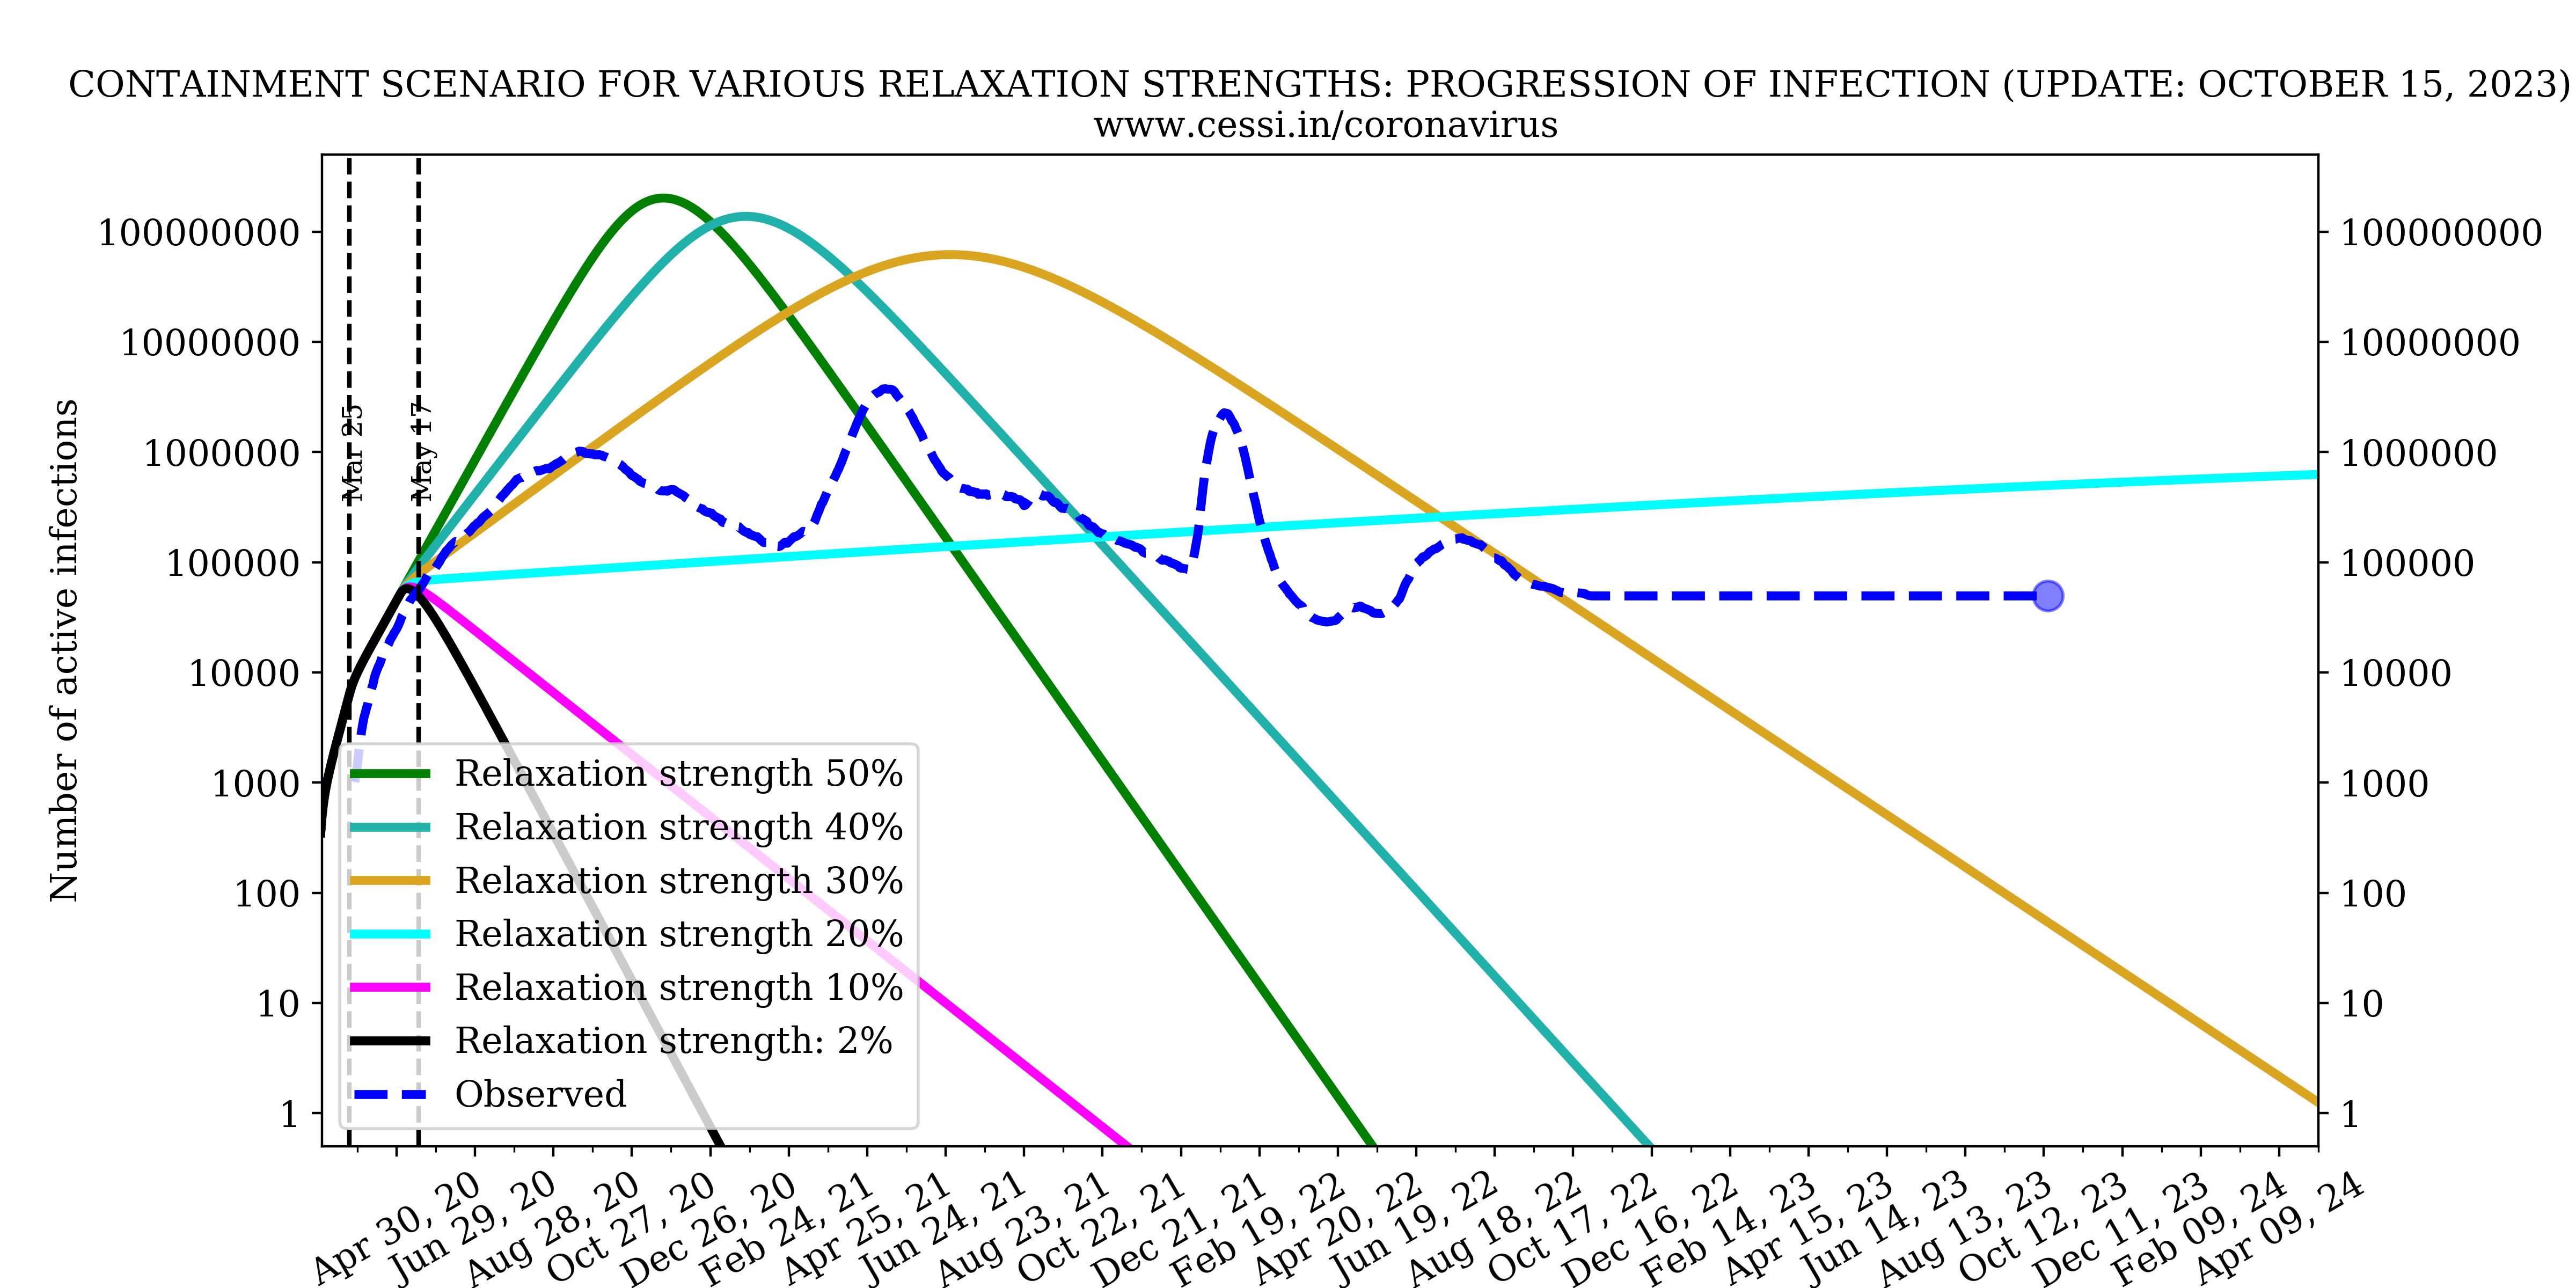
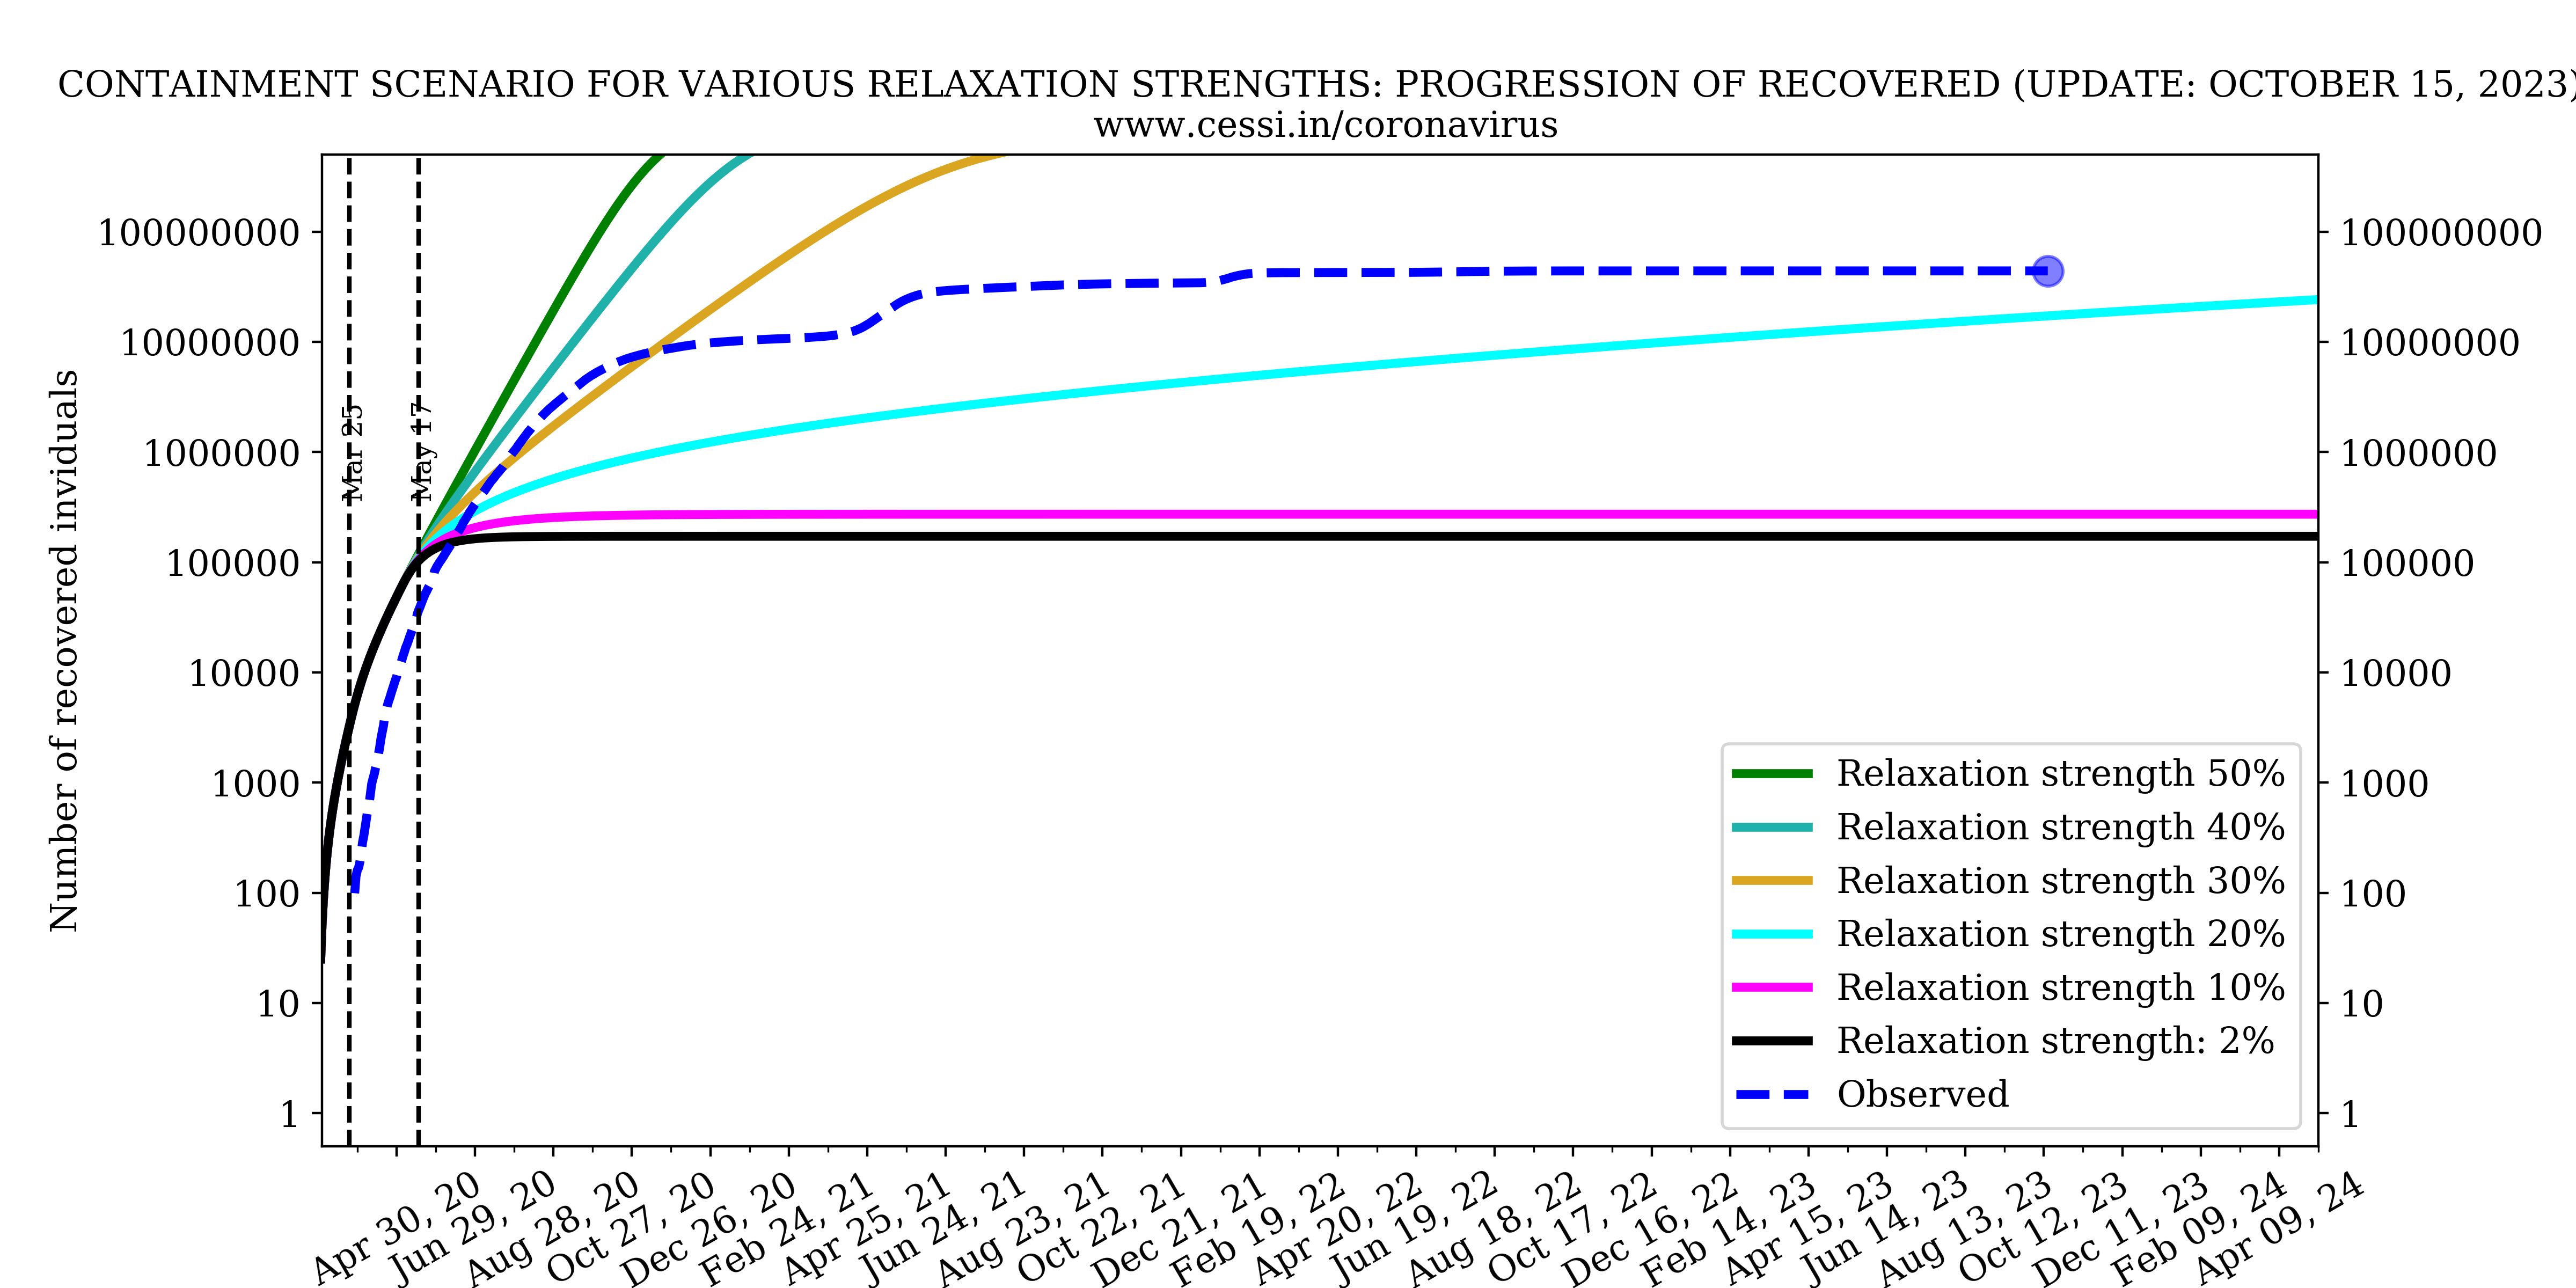
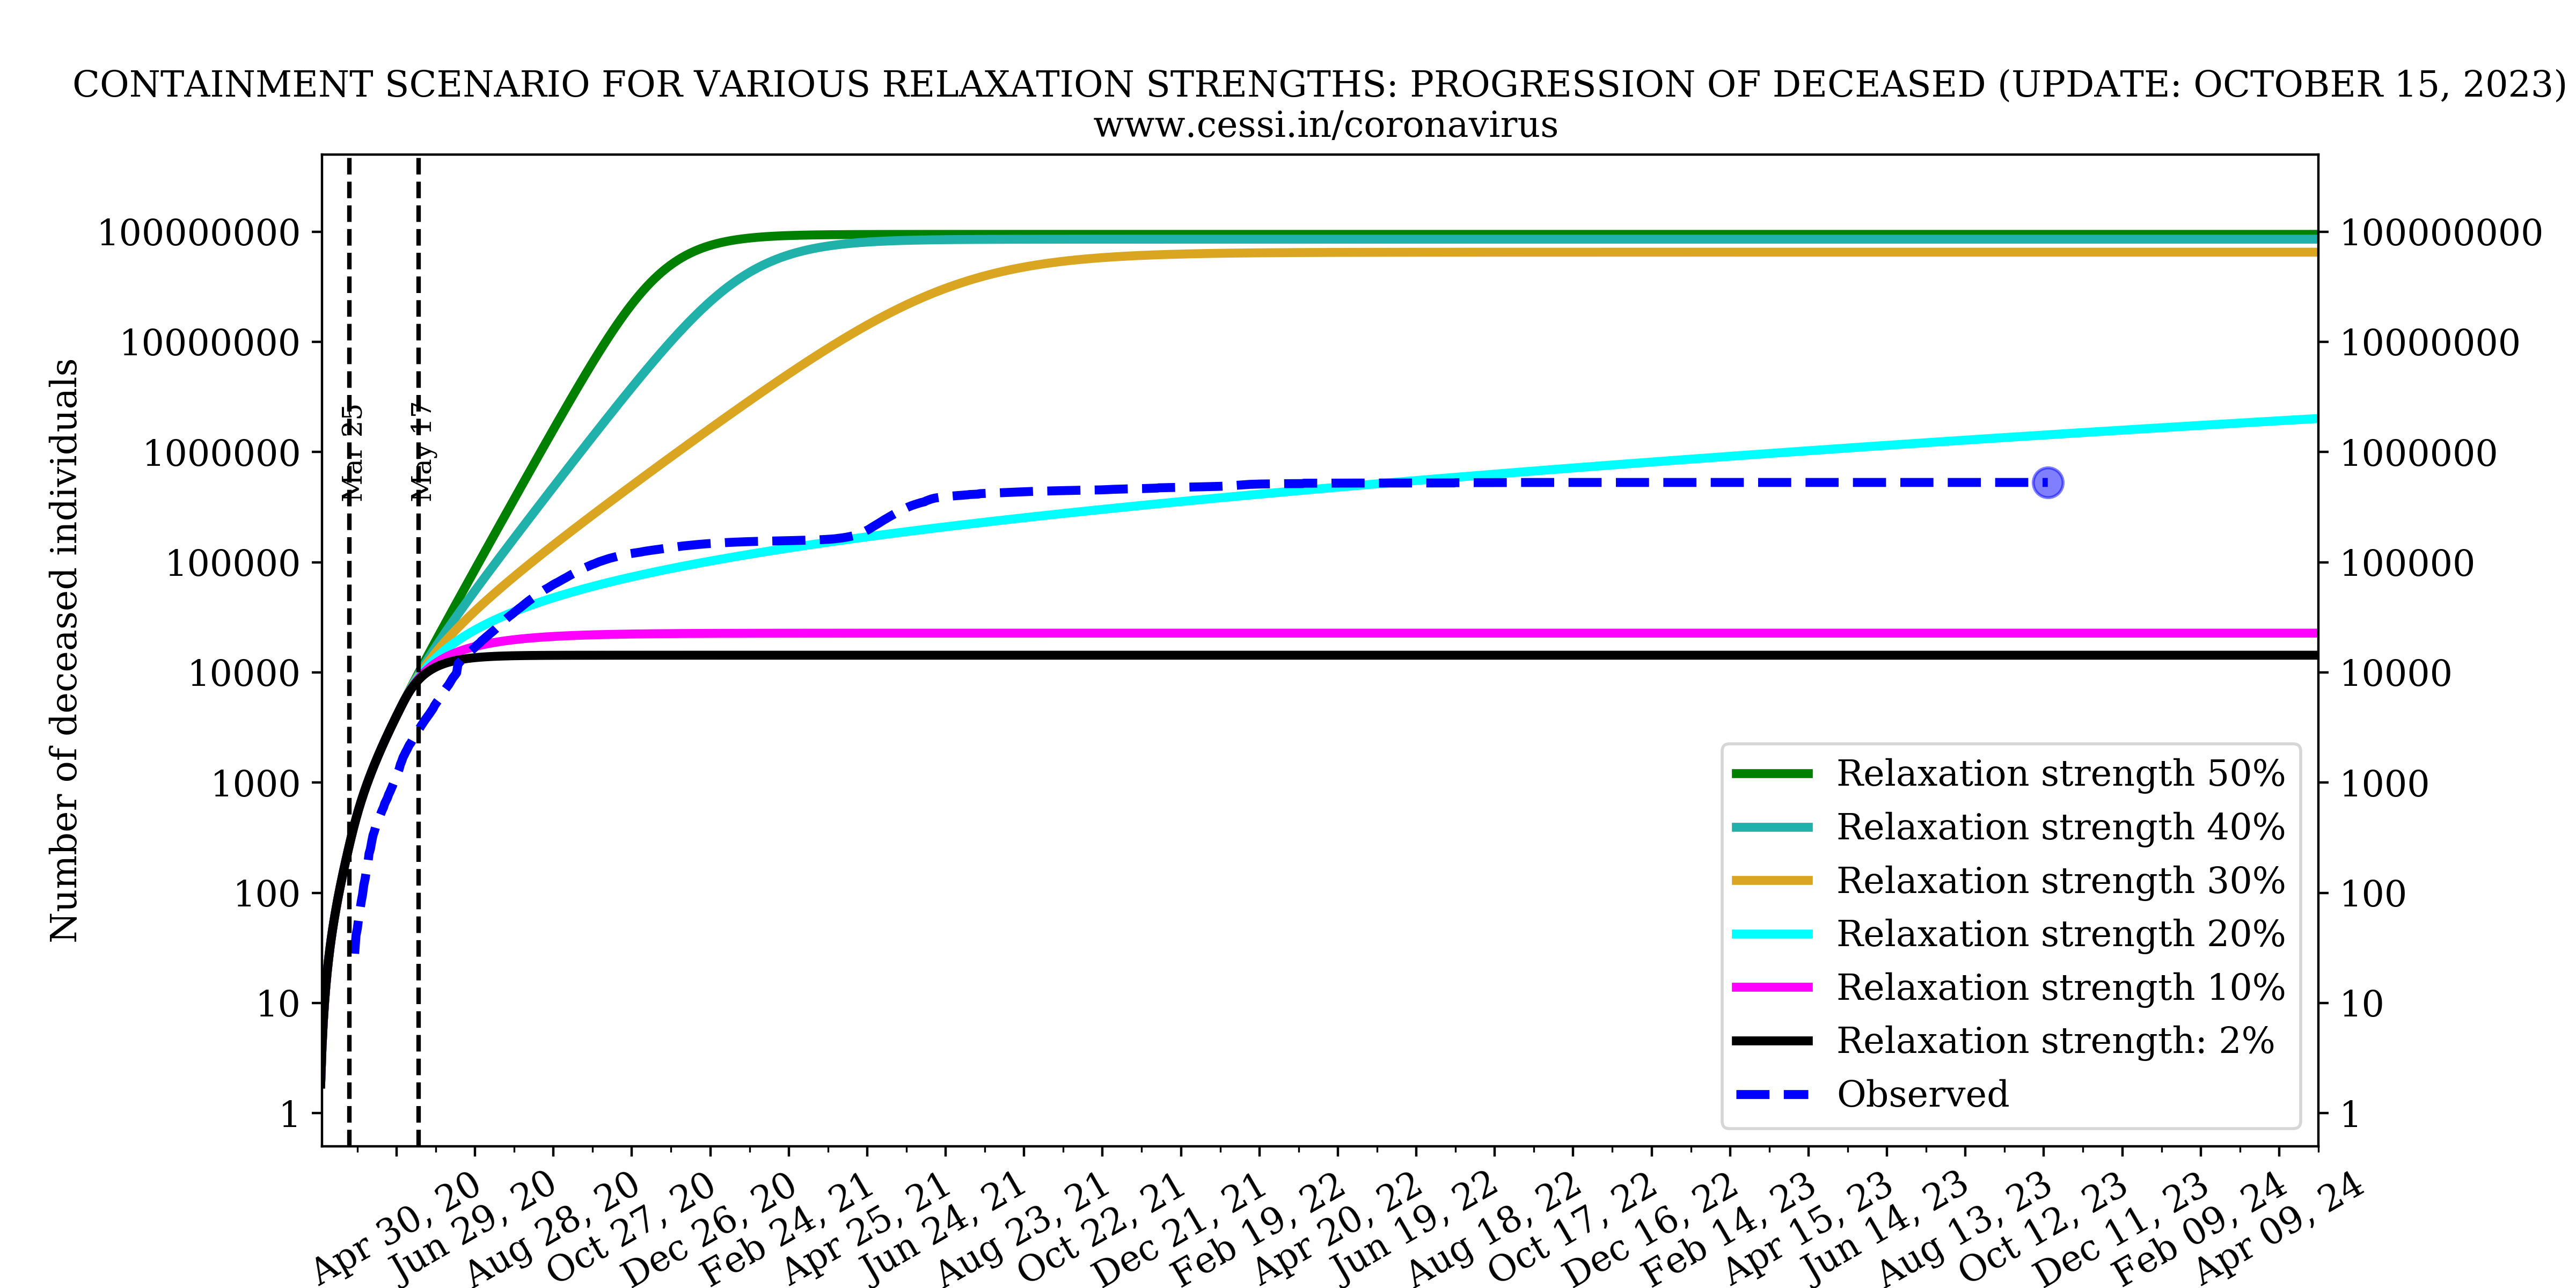
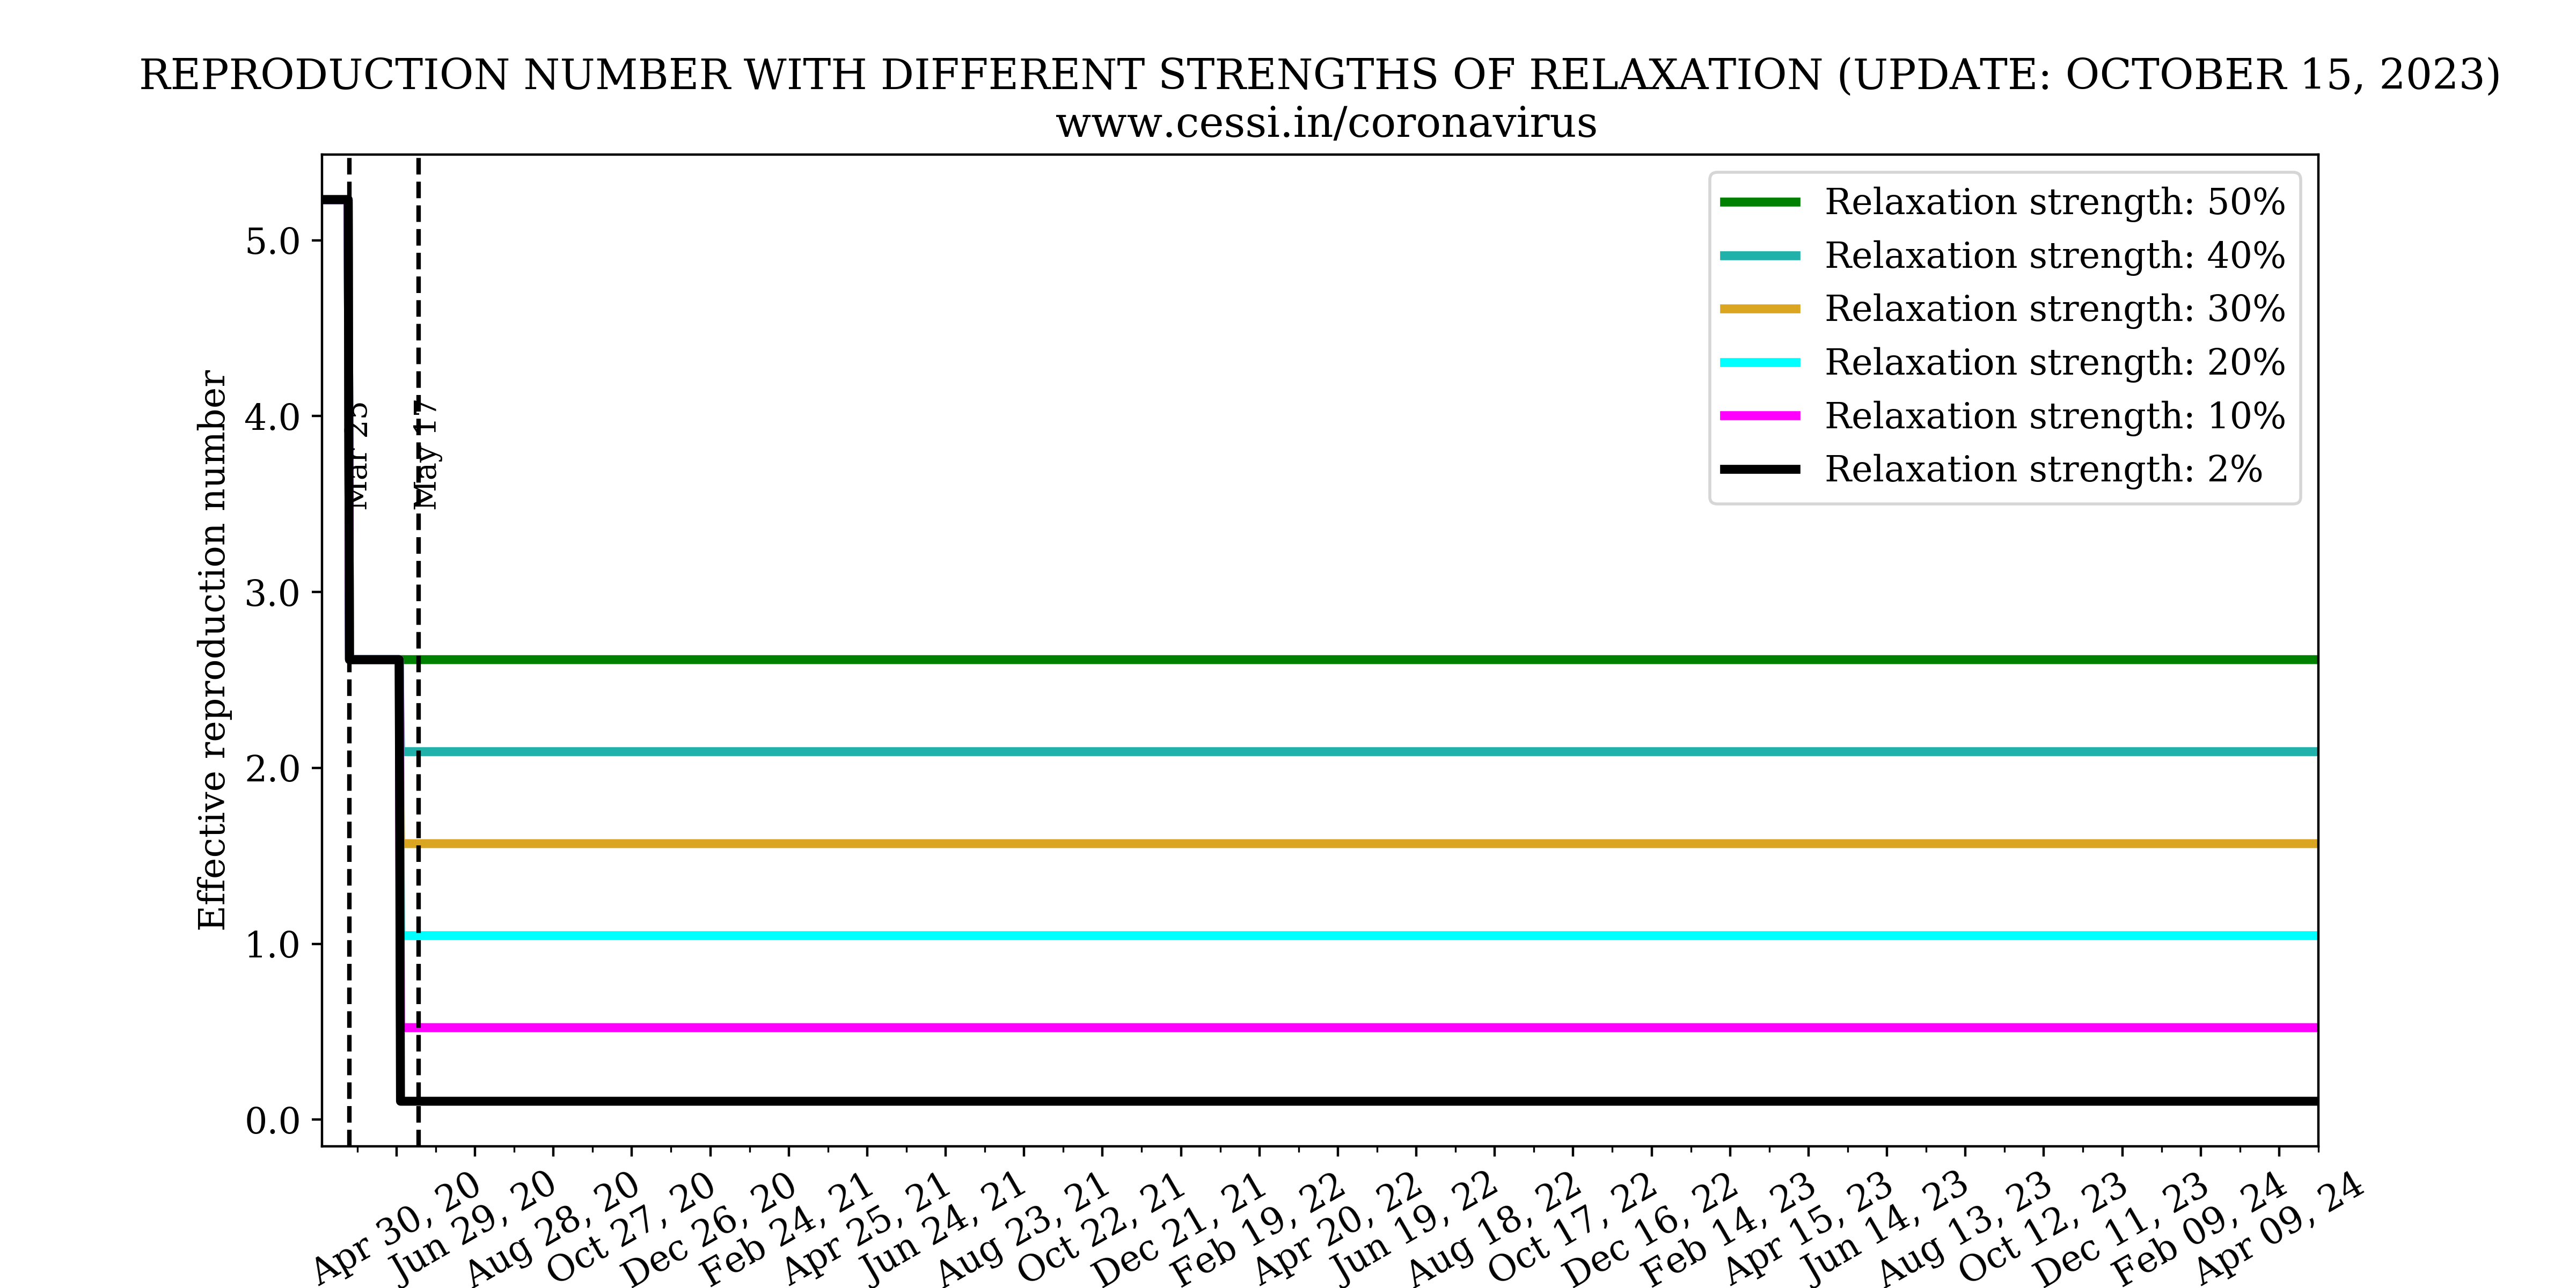
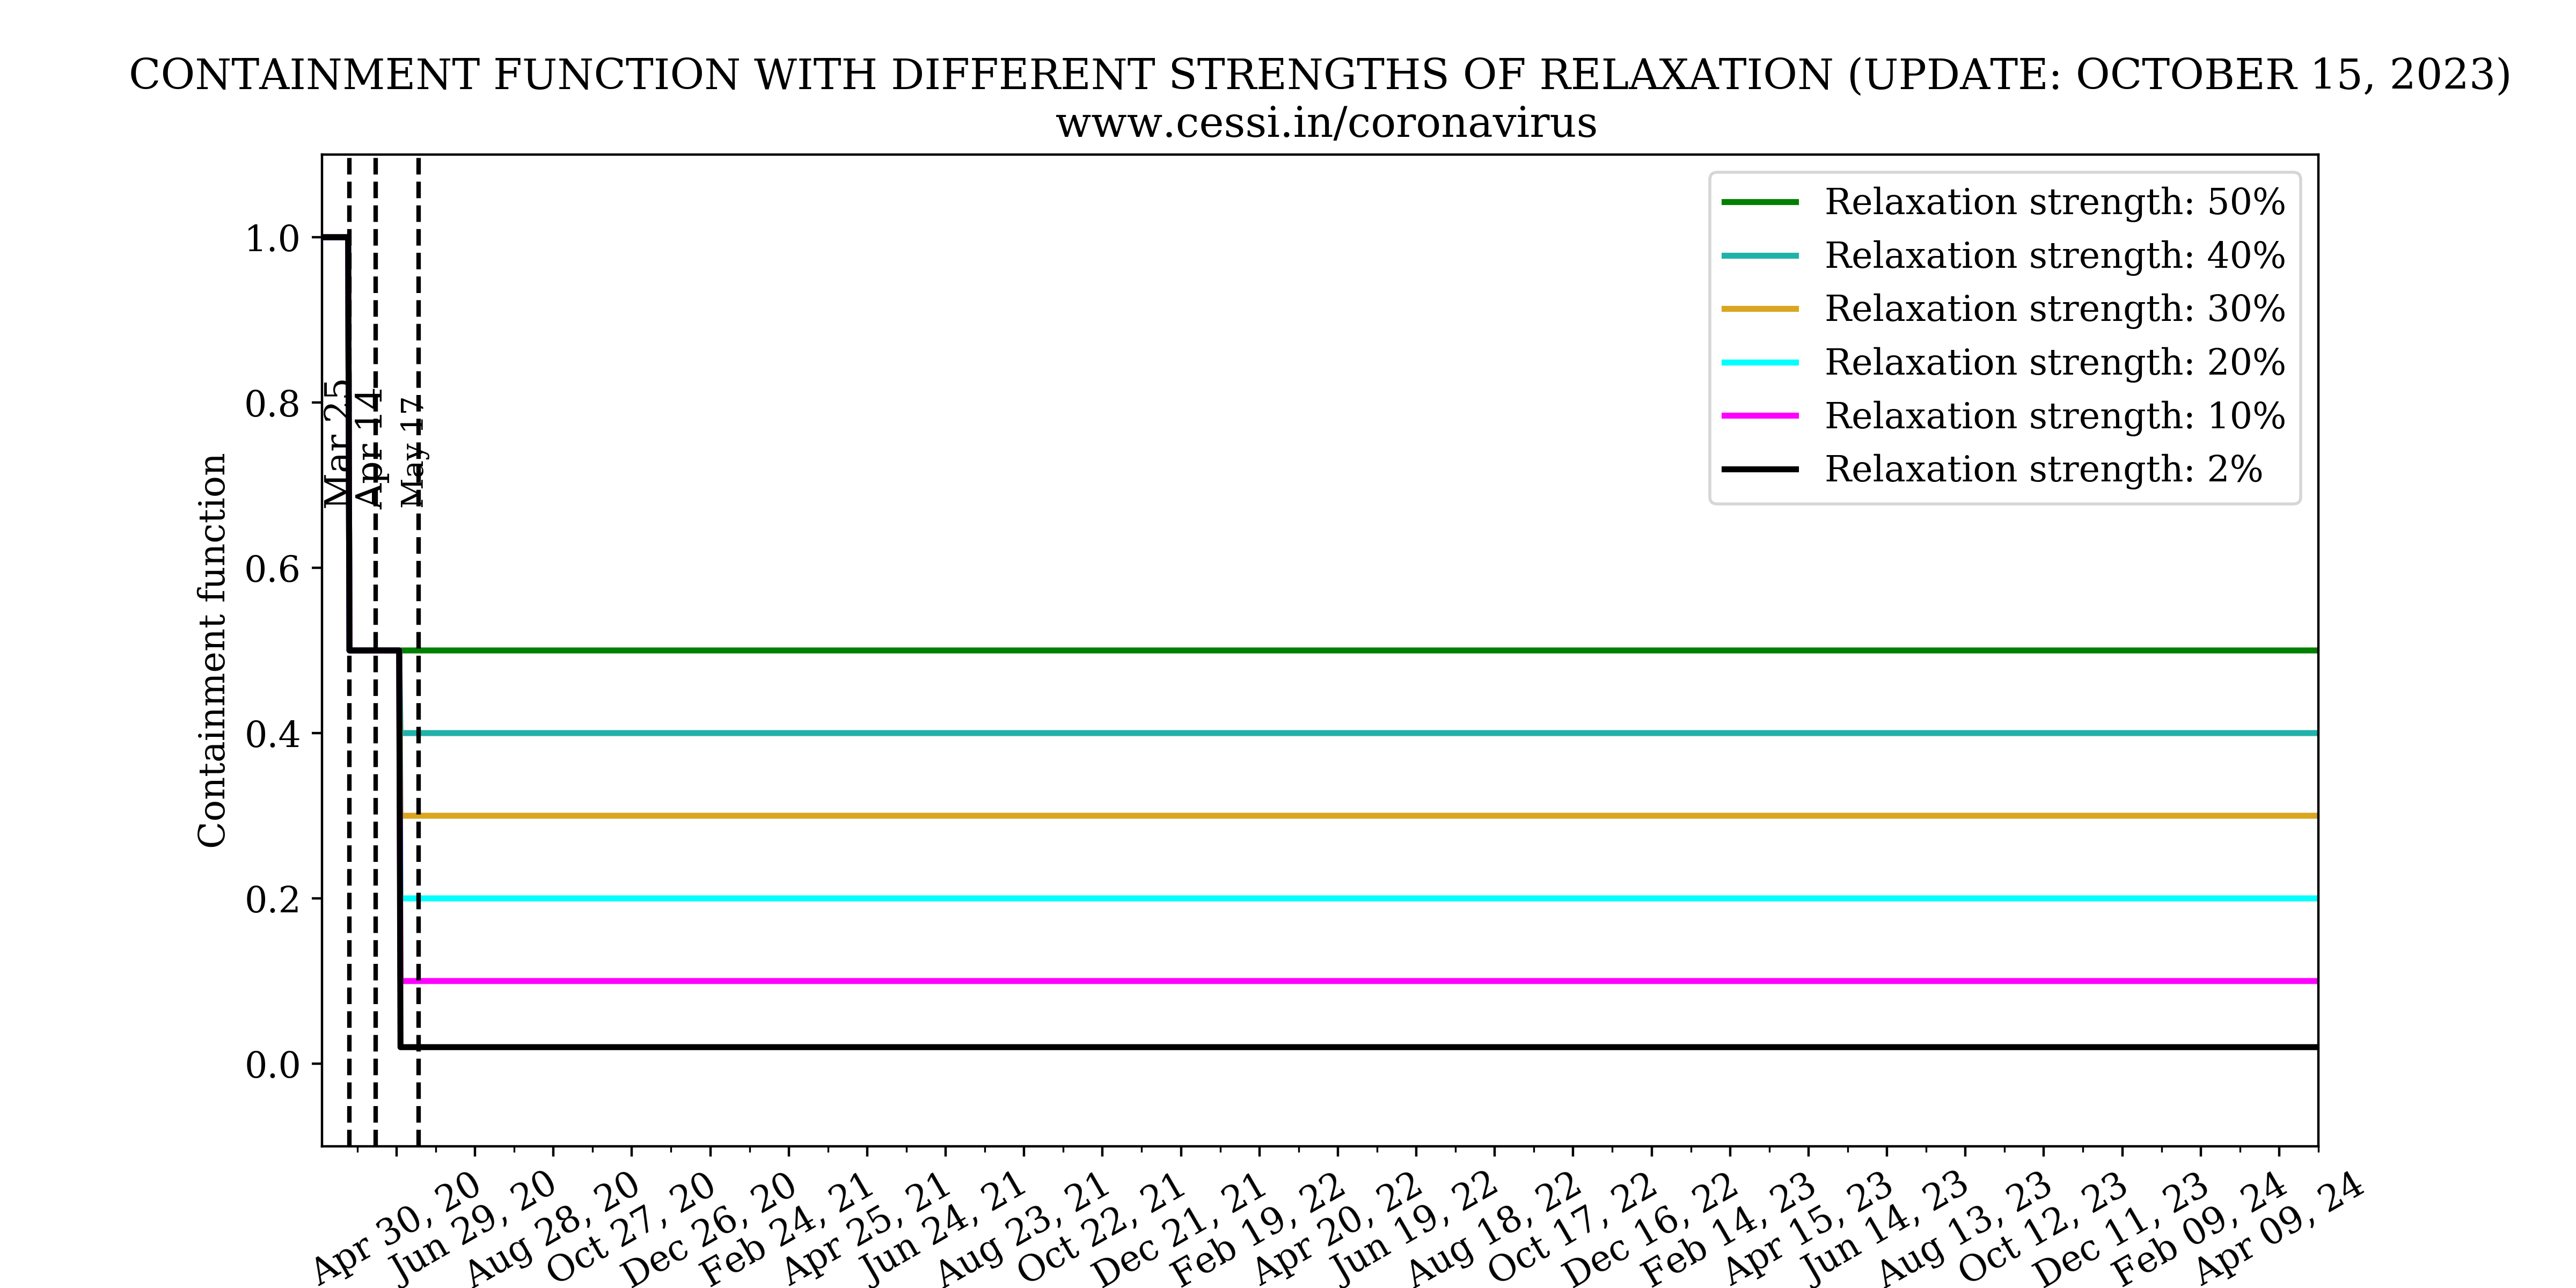

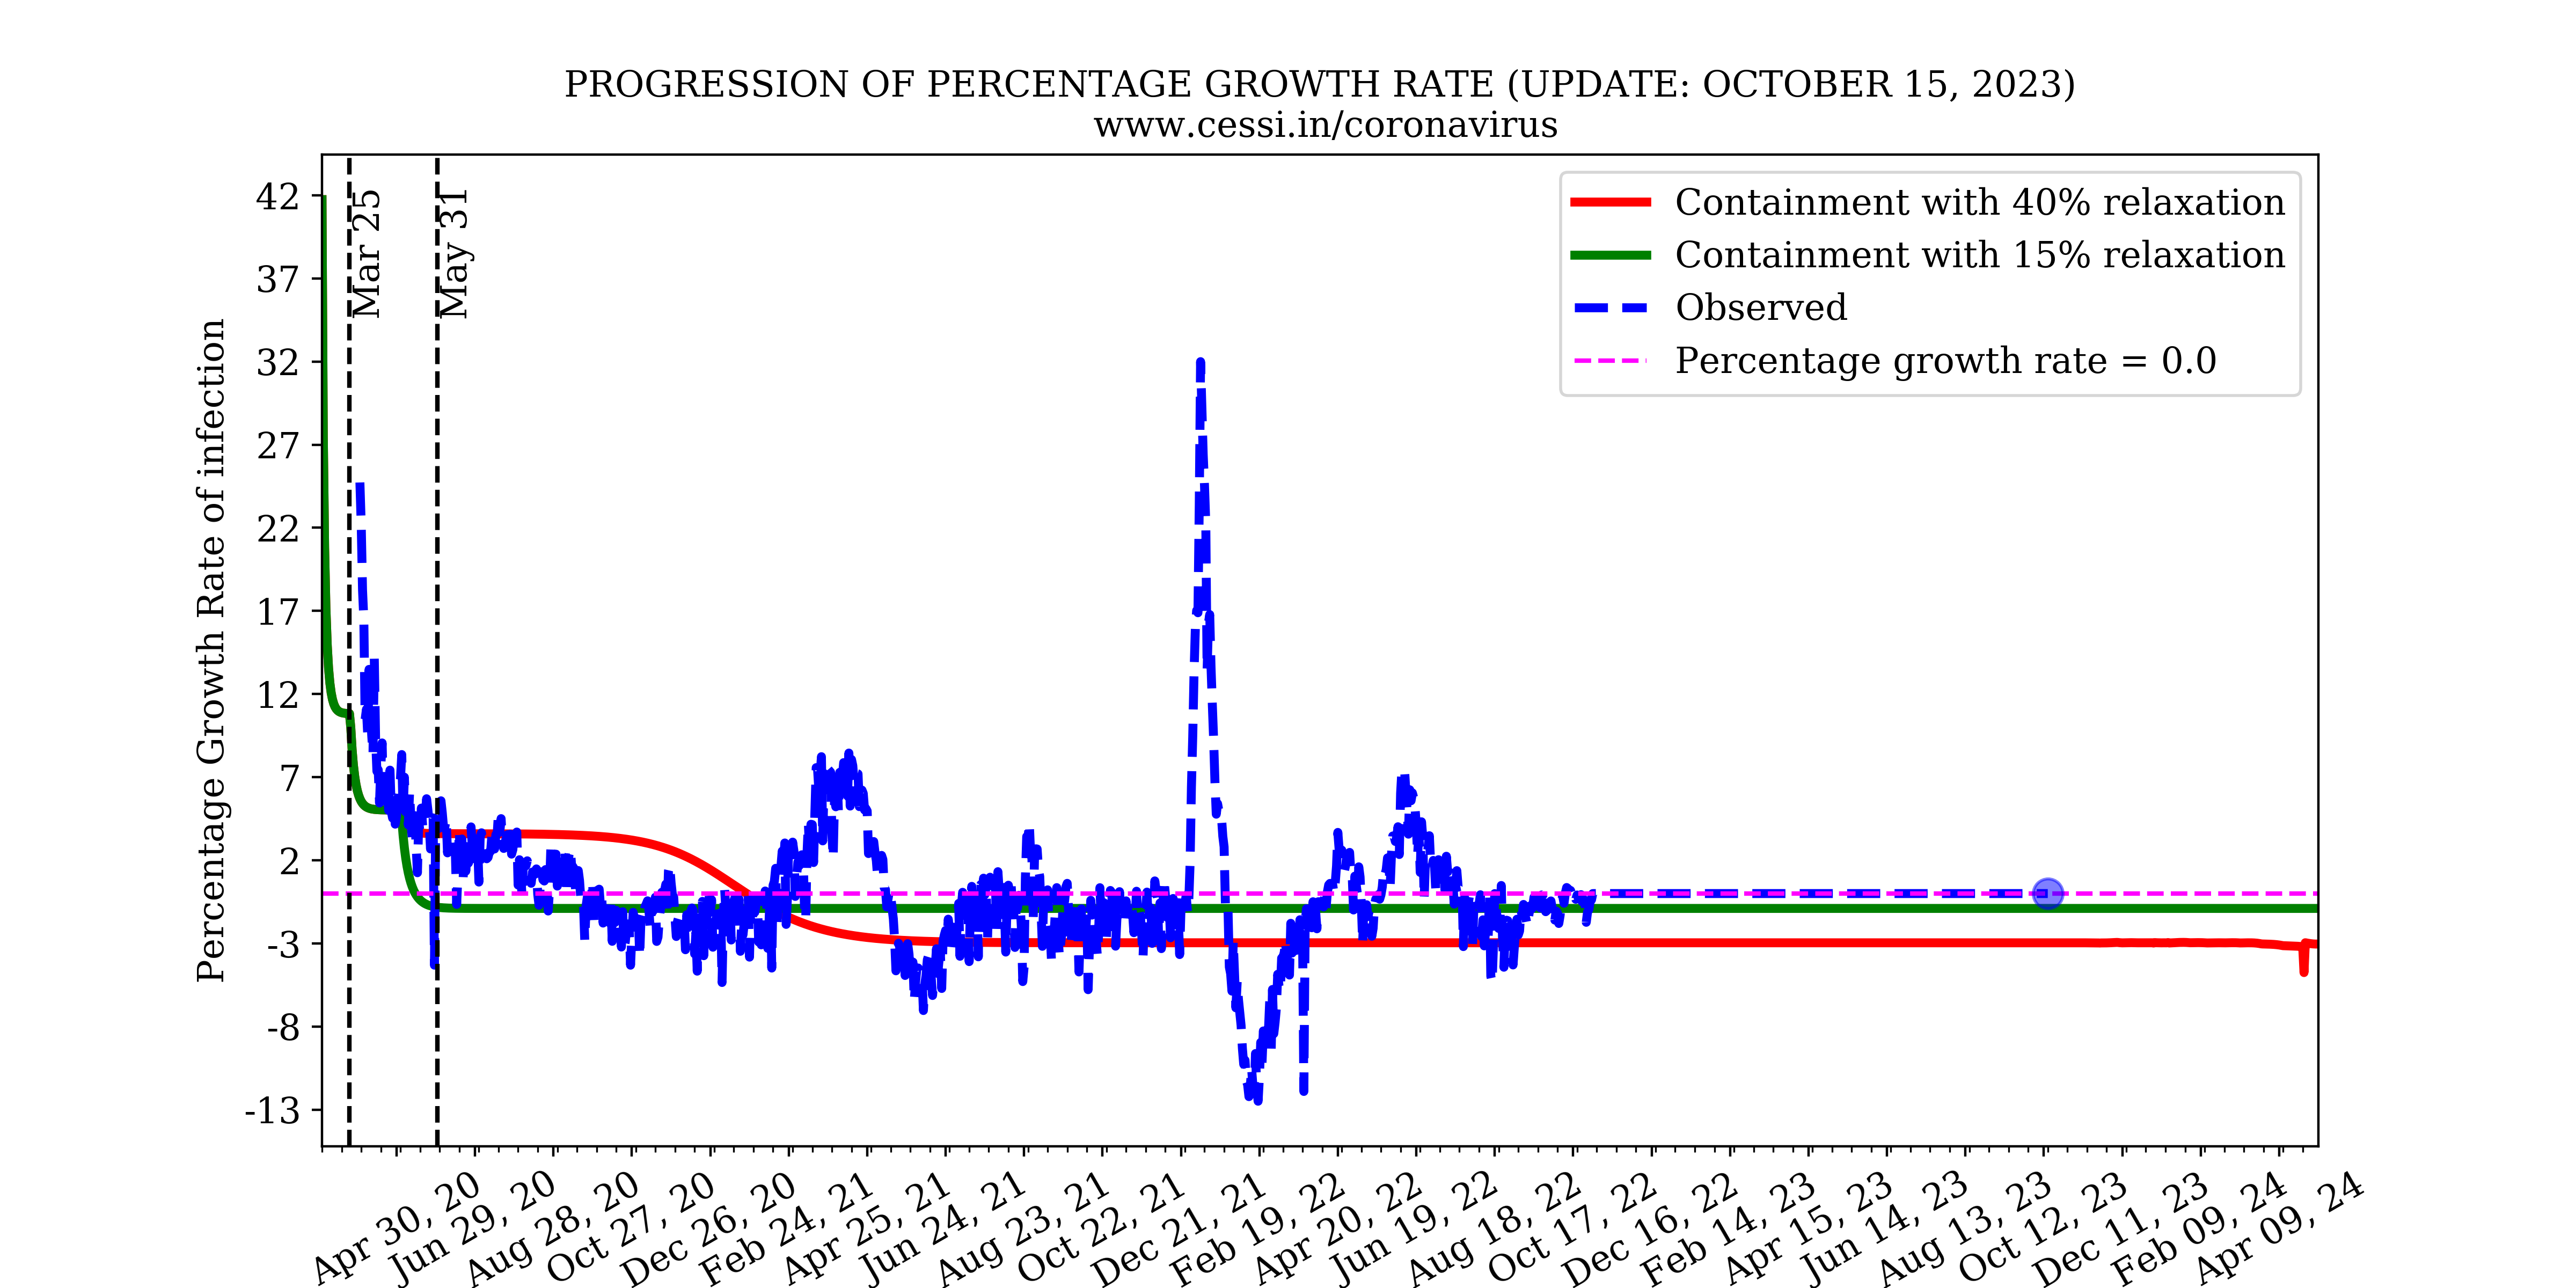
Over and beyond the intrinsic growth rates and reproduction numbers, the efficiency of the national lockdown and human behaviour controls the growth rate of this pandemic. Based on model fits to the observed growth of the pandemic, our simulation indicates that an increasingly efficient containment (which is implemented via a declining step function across different phases of the Indian lockdown) is able to reasonably match the early available observations. This best-case scenario simulation (black curve) forecast performed by us in late April indicated a peak active infection of about 60,000 around 17 May. Clearly, it appears that the current observation (blue-dashed curve with current number indicated by a dot) has surpassed that indicating a more inefficient containment than assumed. We perform multiple simulations with increasing inefficiency in lock down (i.e., equivalent to more relaxations in the containment) to assess possible future progression of the pandemic. We find that with increasing relaxations in the containment, the simulated active infections rise more rapidly, as expected. The current active infection growth curve is progressing at a rate suggestive of a relaxation in the containment to 30%-40% level (i.e., working at a 70%-60% efficiency).
4. What are the key observational quantities that might help us monitor the current situation of COVID19 progression?
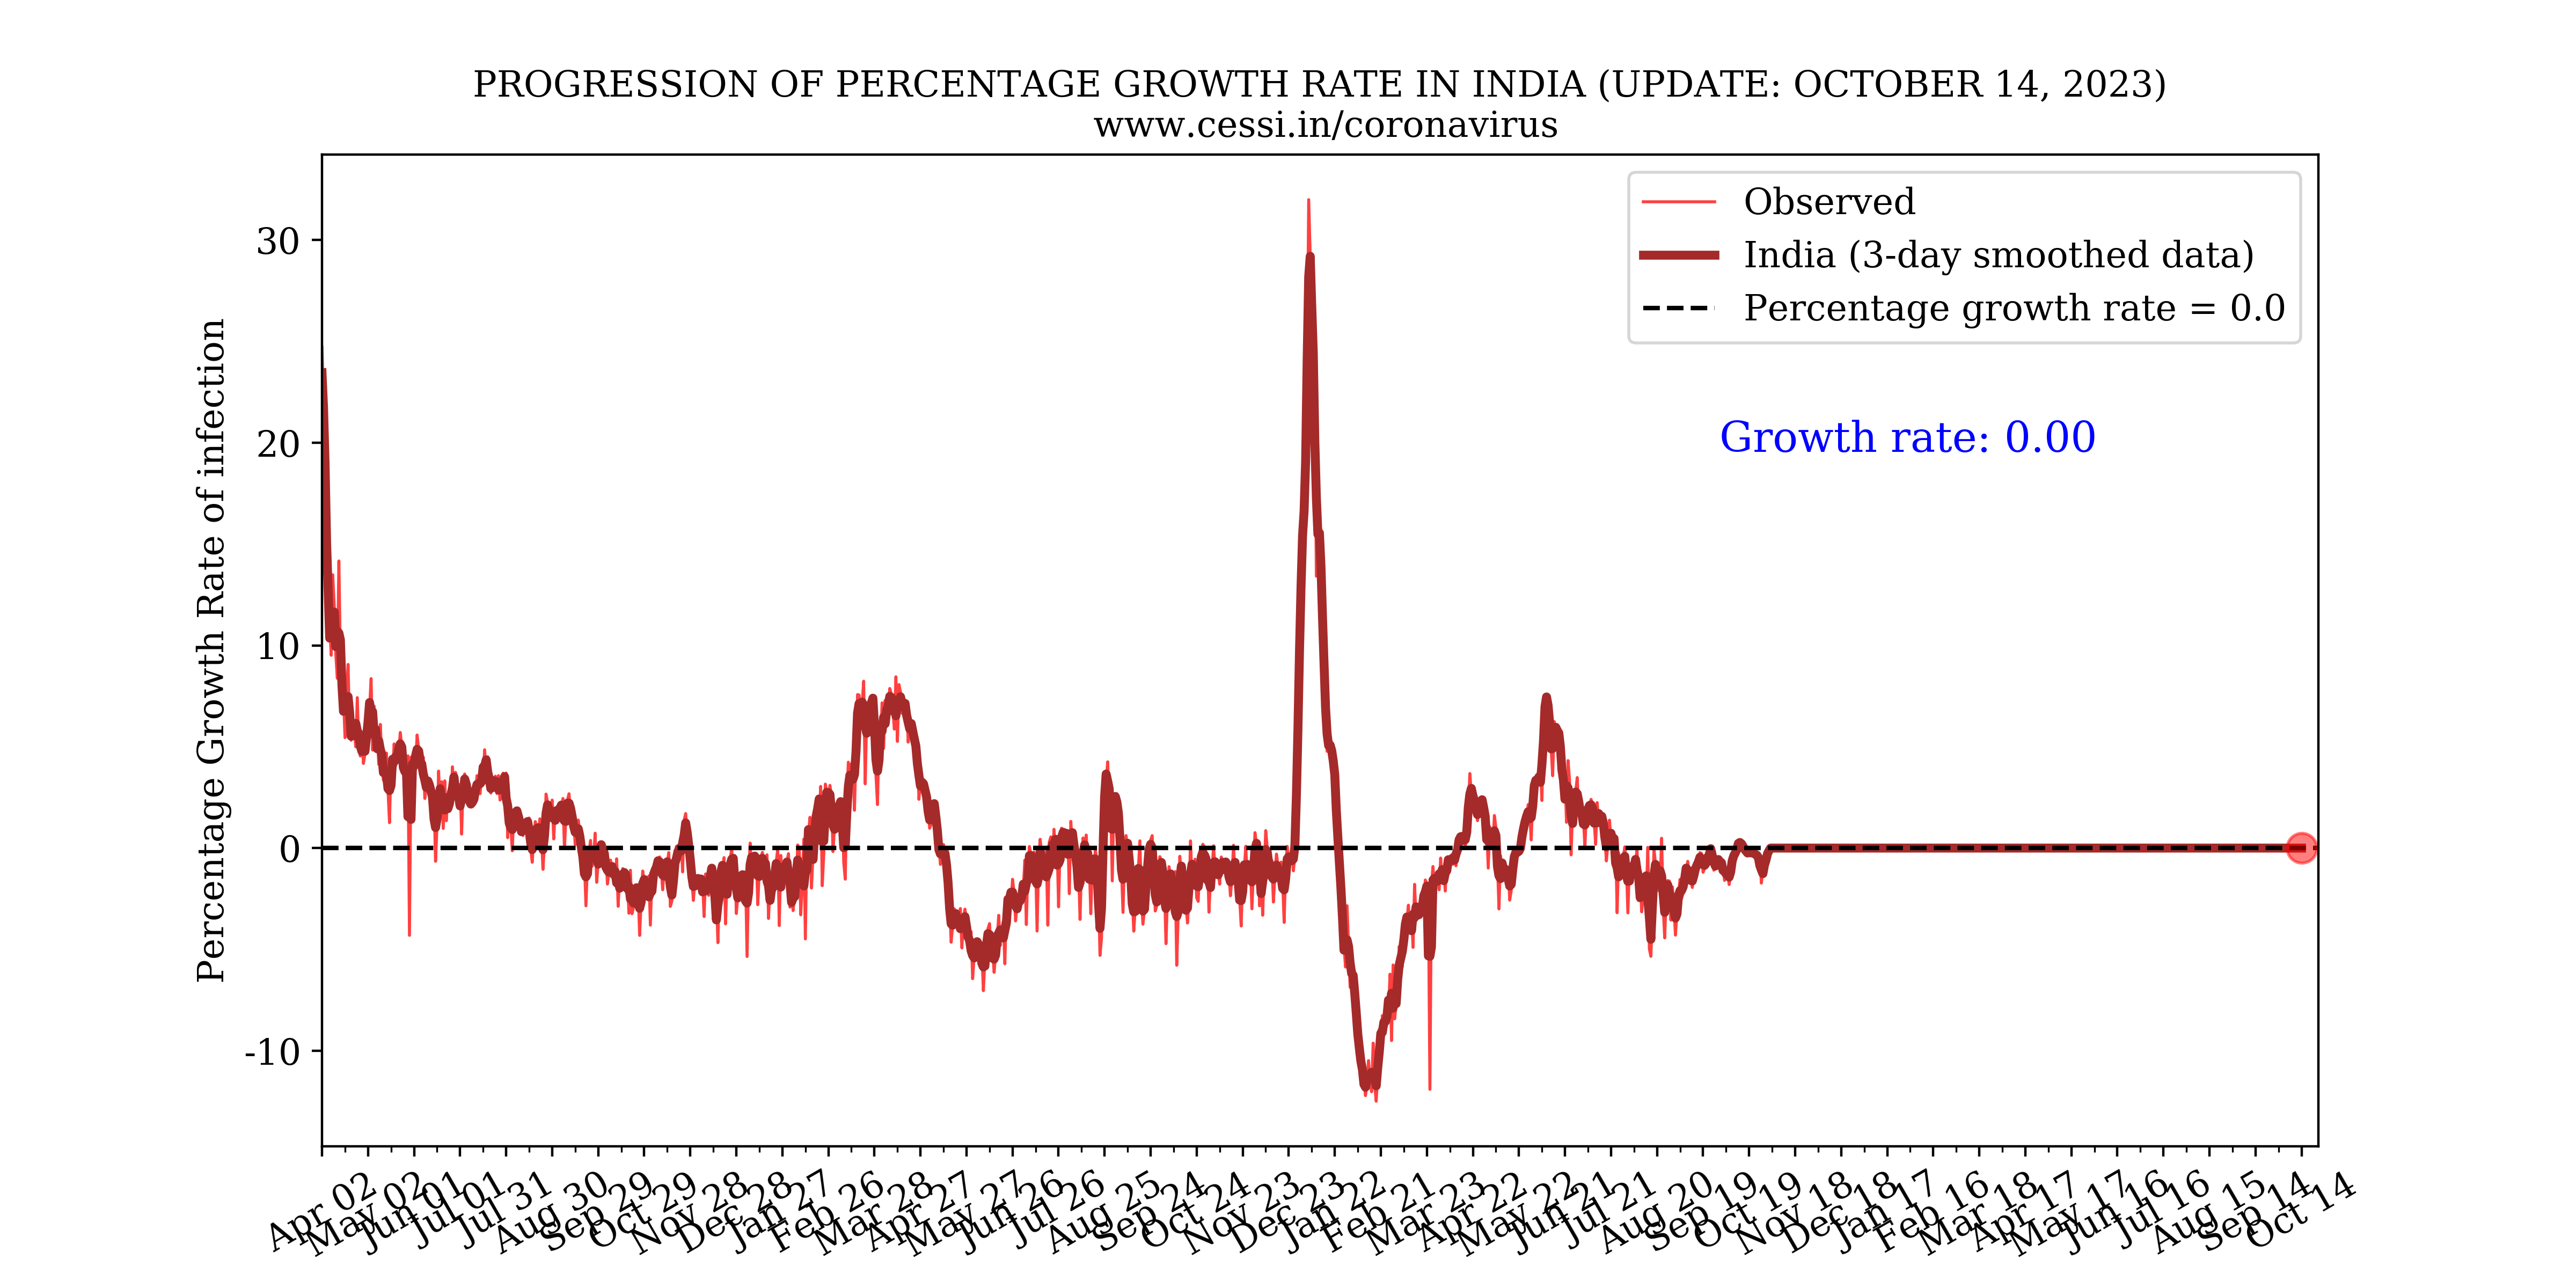
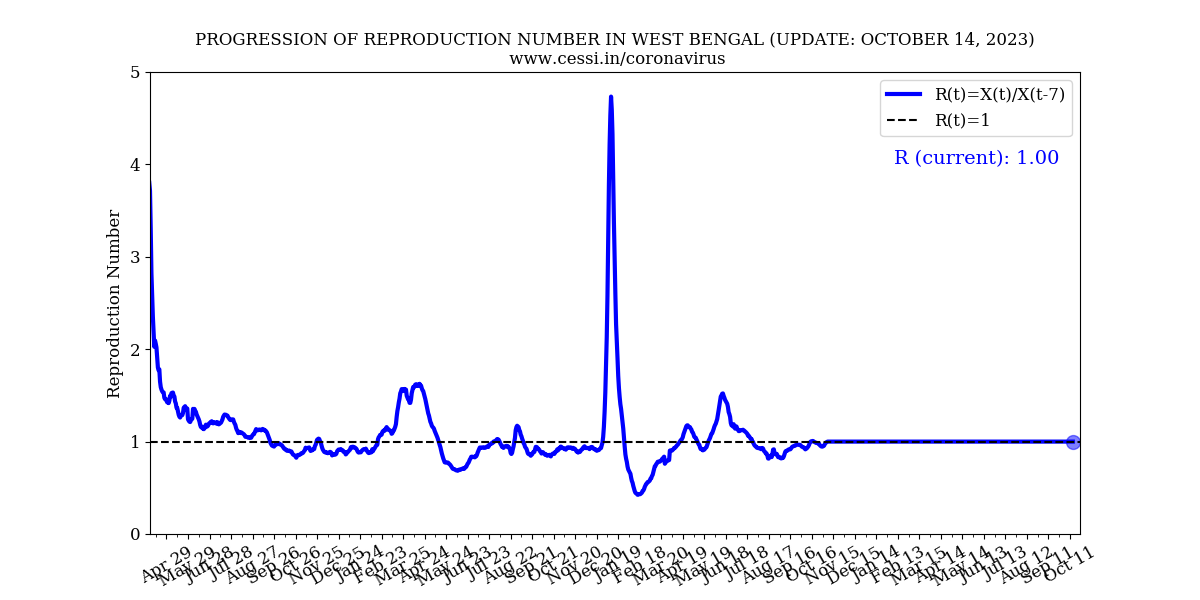
The ratio of the number of new cases on a day to the total number of cases on that day also known as the growth rate, helps us monitor the rise/decay of the pandemic. This is plotted on the left panel above. It can be seen that all three growth rates are stabilizing after the lockdown. Additionally, we plot the Reproduction number versus time in the right panel above. Reproduction number(R) is the number of people infected by a single infected person. The Reproduction number below 1 is desirable to slow the spread of the virus. These observed quantities are helpful in monitoring the progression of the pandemic and the effect of different lockdown policies. As the reporting of confirmed cases after testing is one of the fundamental quantities to understand the progression of the pandemic, we have used 100*daily confirmed/dailytested in order to calculate the observed test positivity percentage for India. This is shown in the plot below. The assumption in this plot is that the results become immediately available on a daily basis following tests, which may not be true. However, the long term trends would not be affected by the validity of this assumption.
5. Would it have been better if India imposed a complete national lockdown even earlier in February 2020?
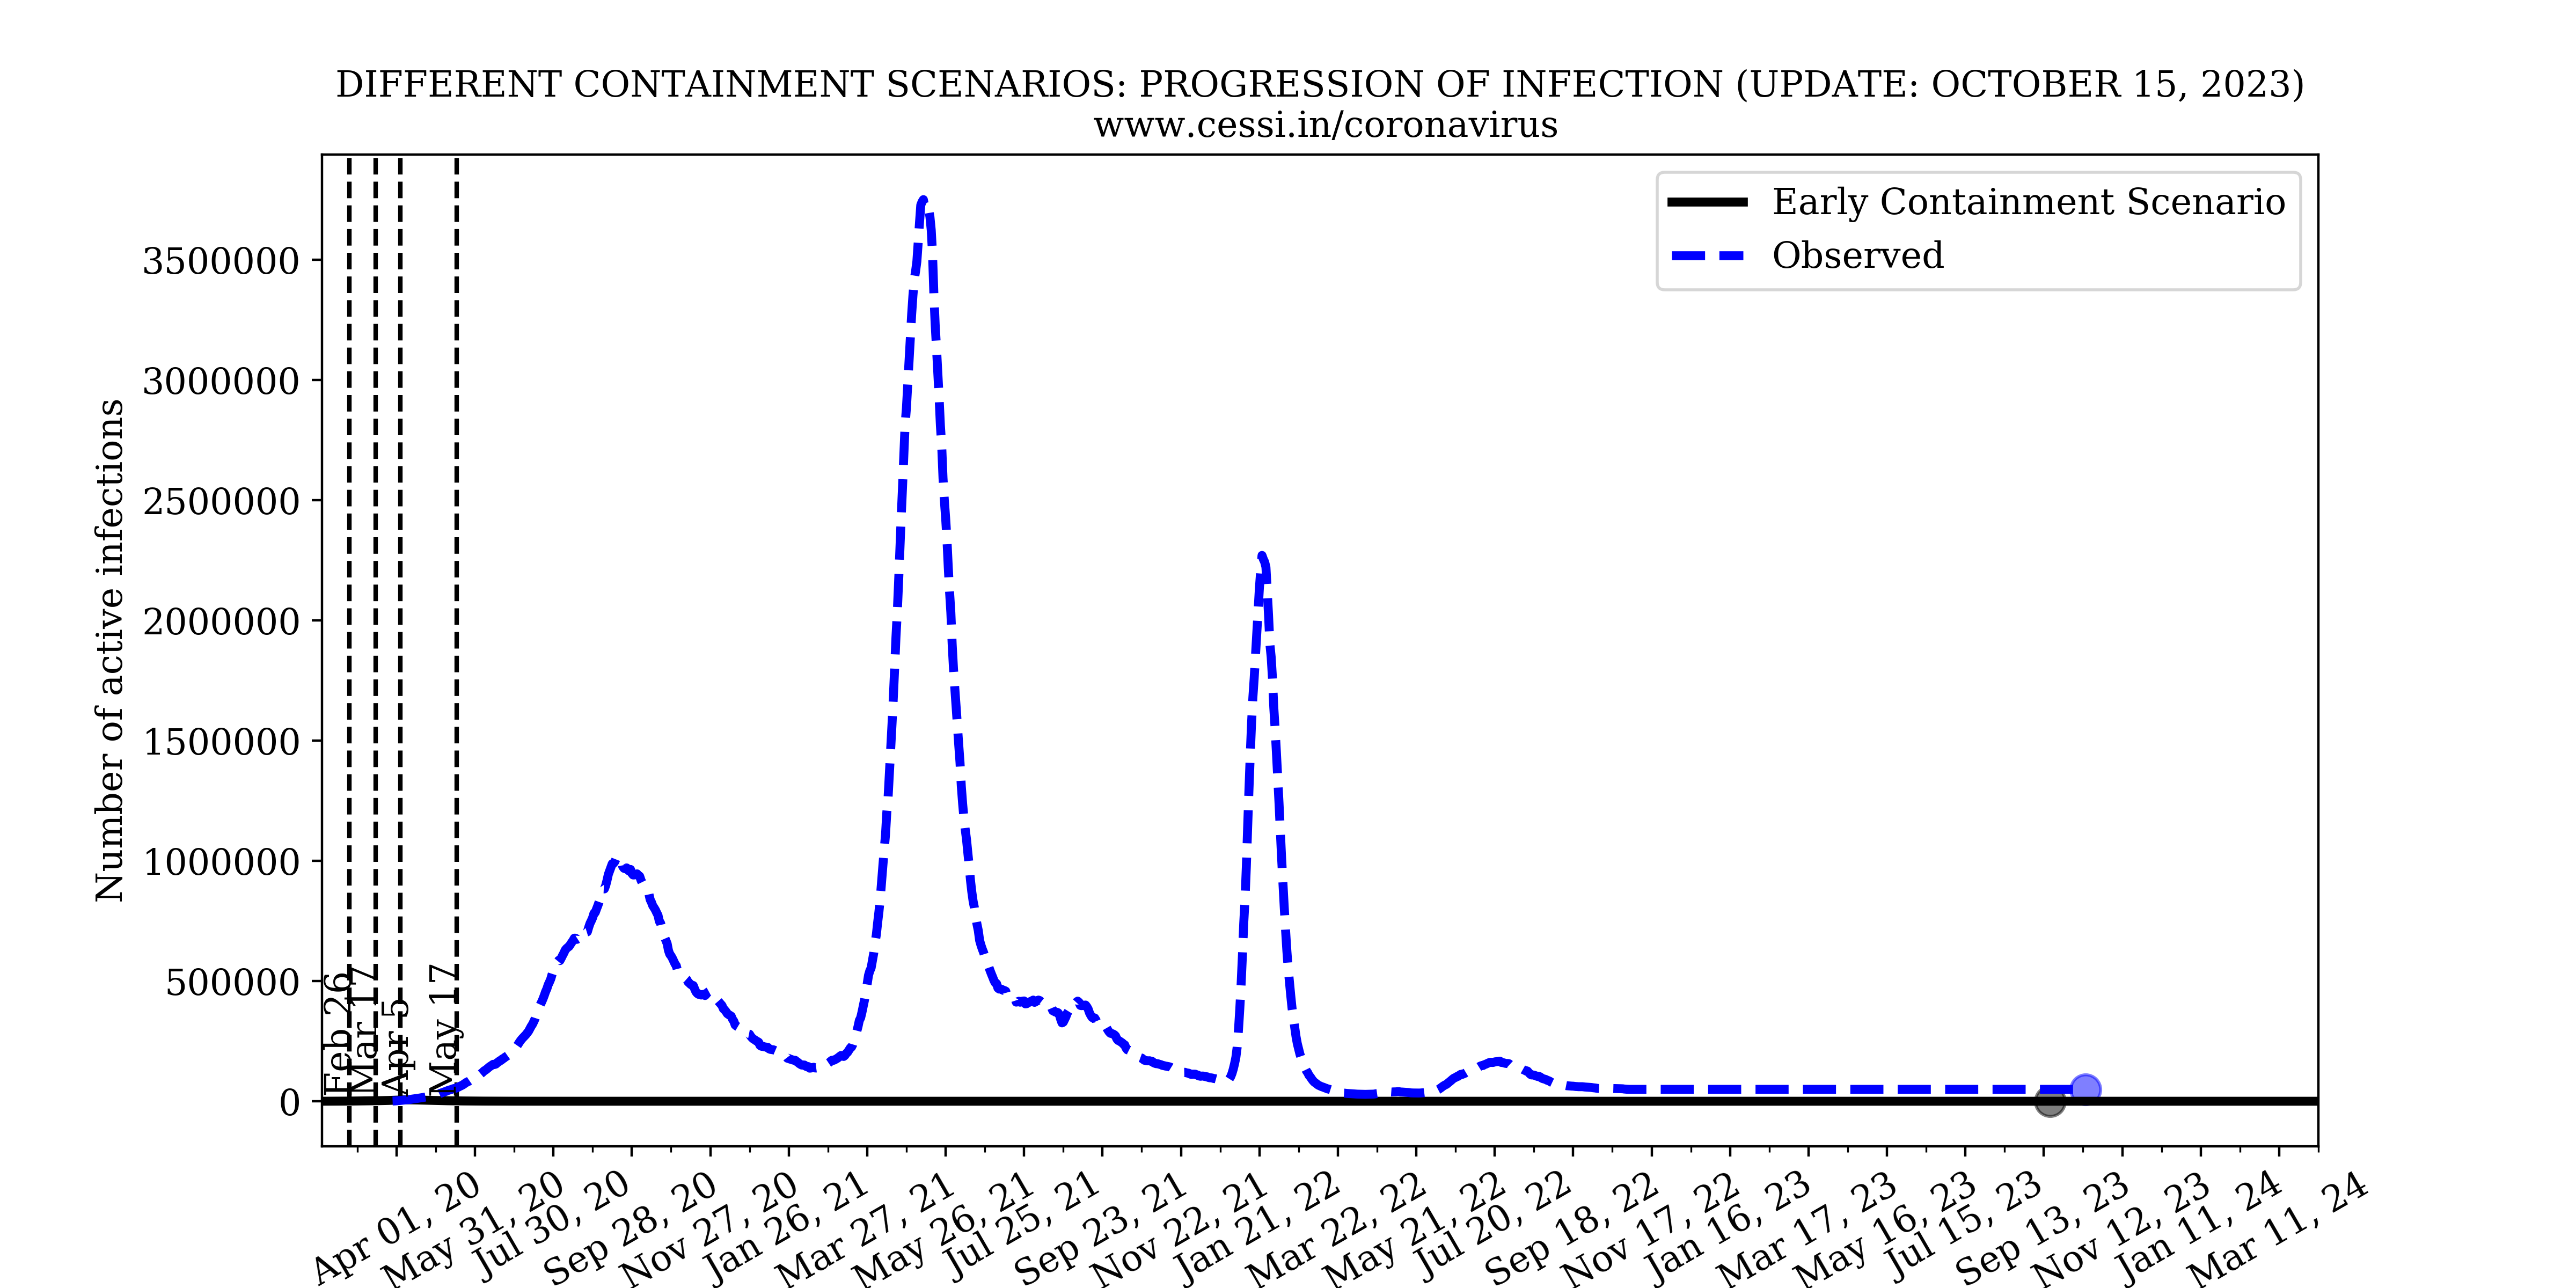
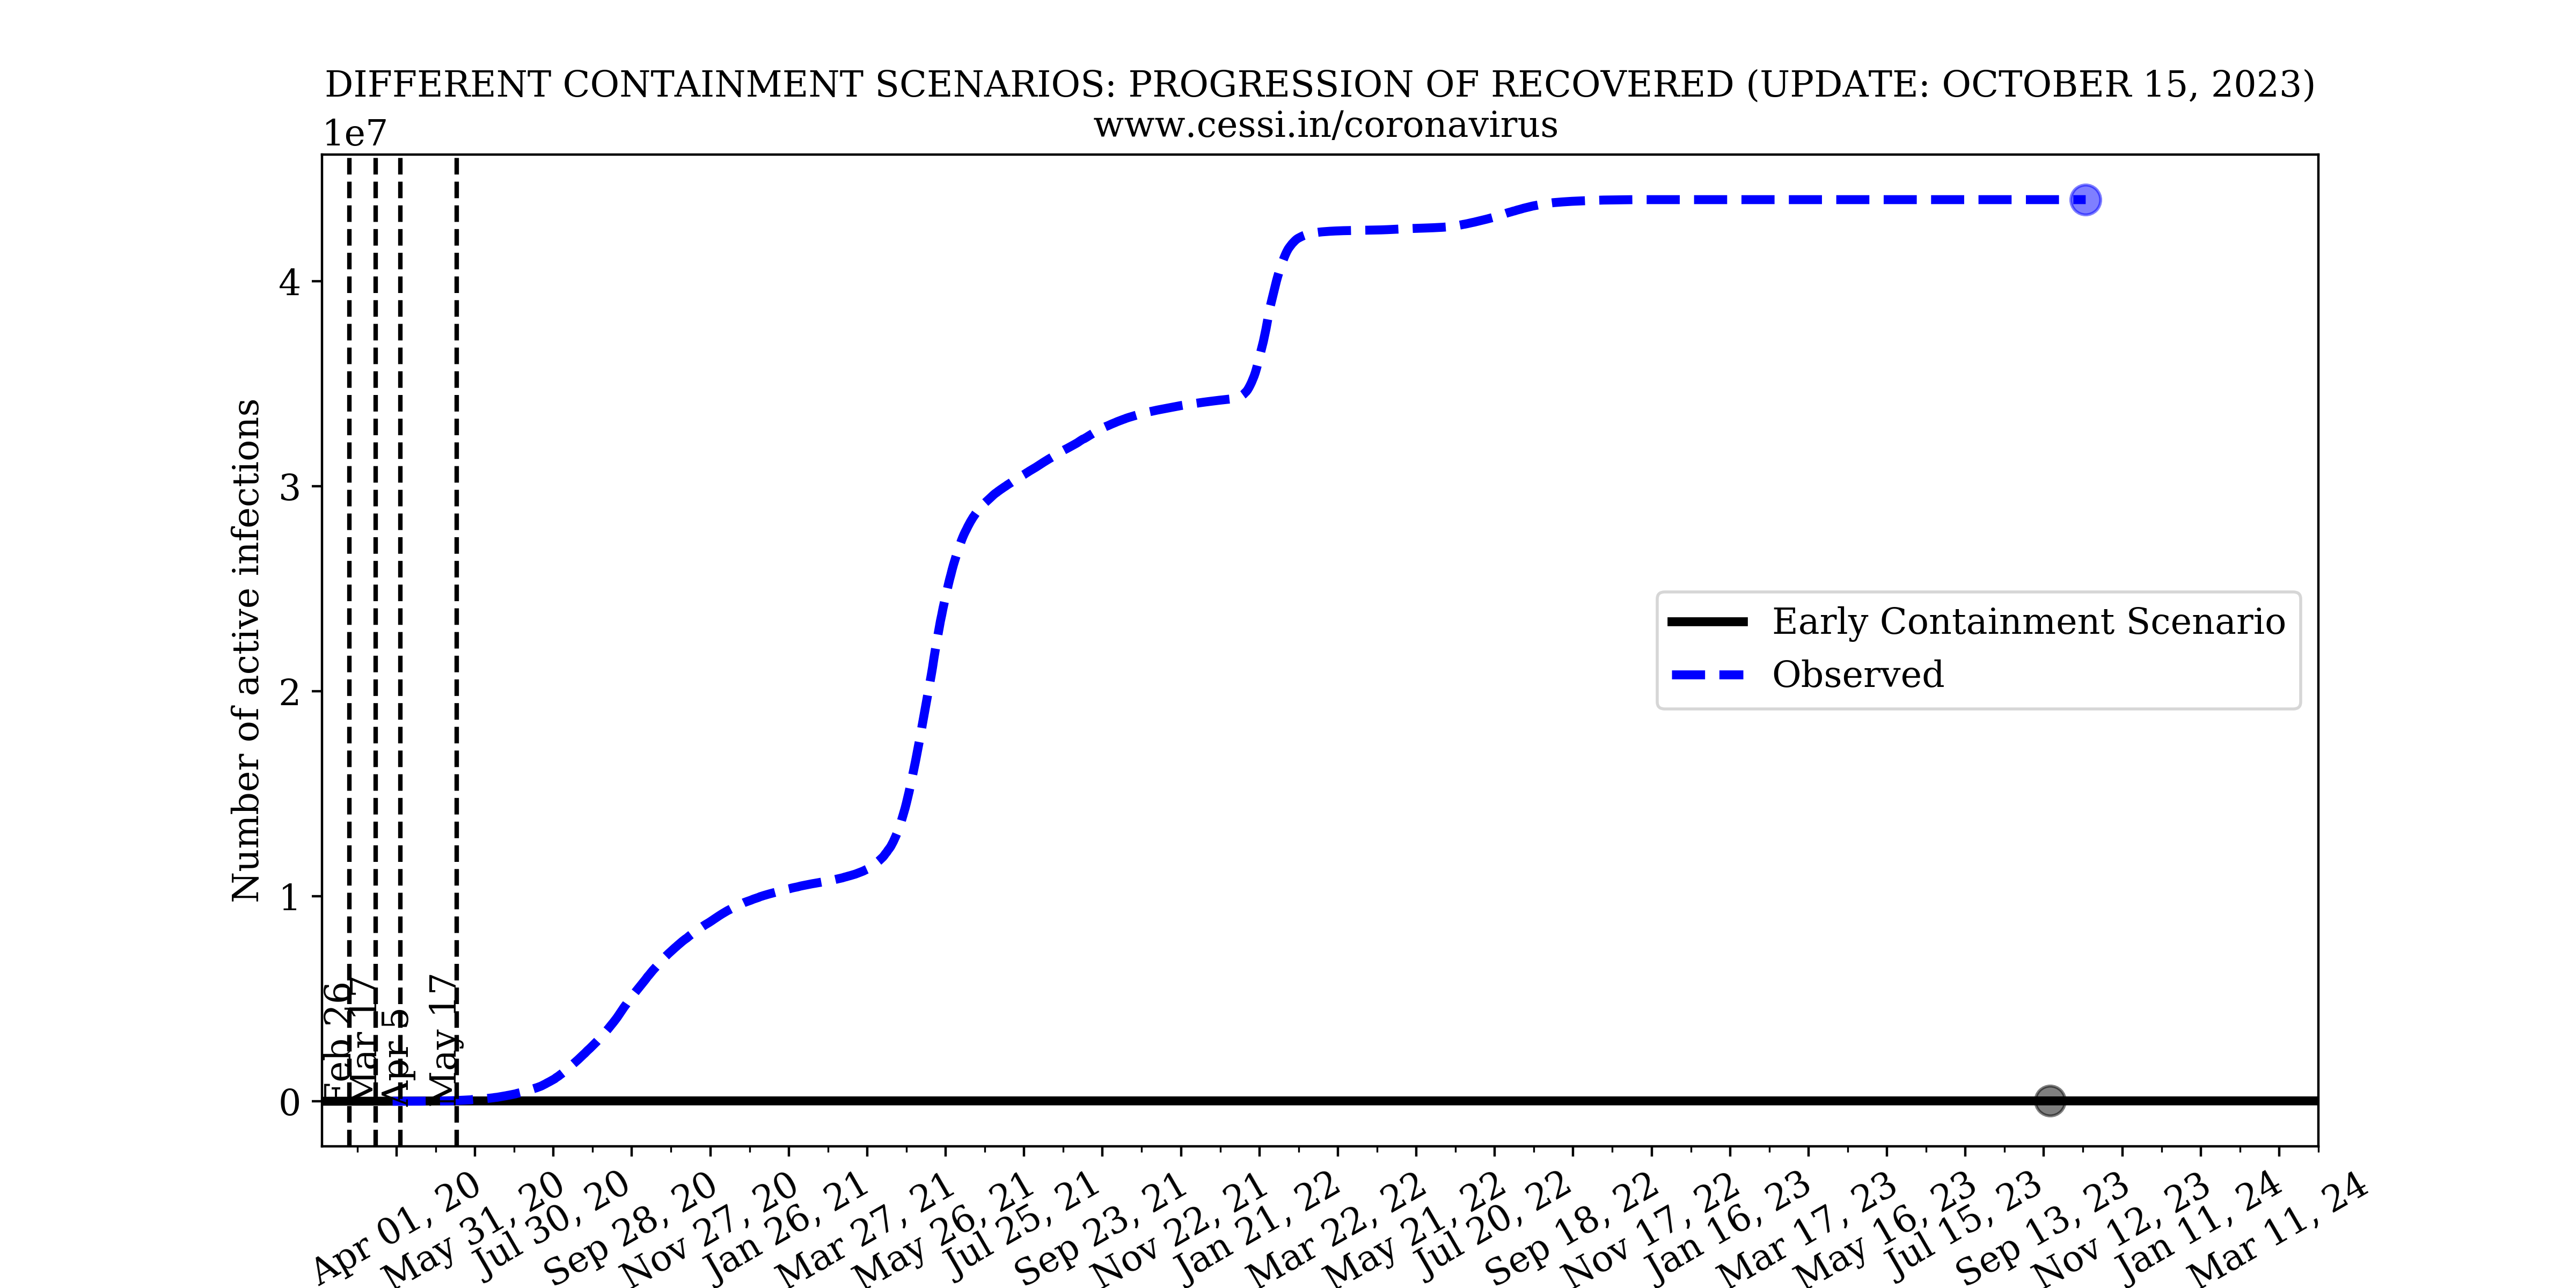
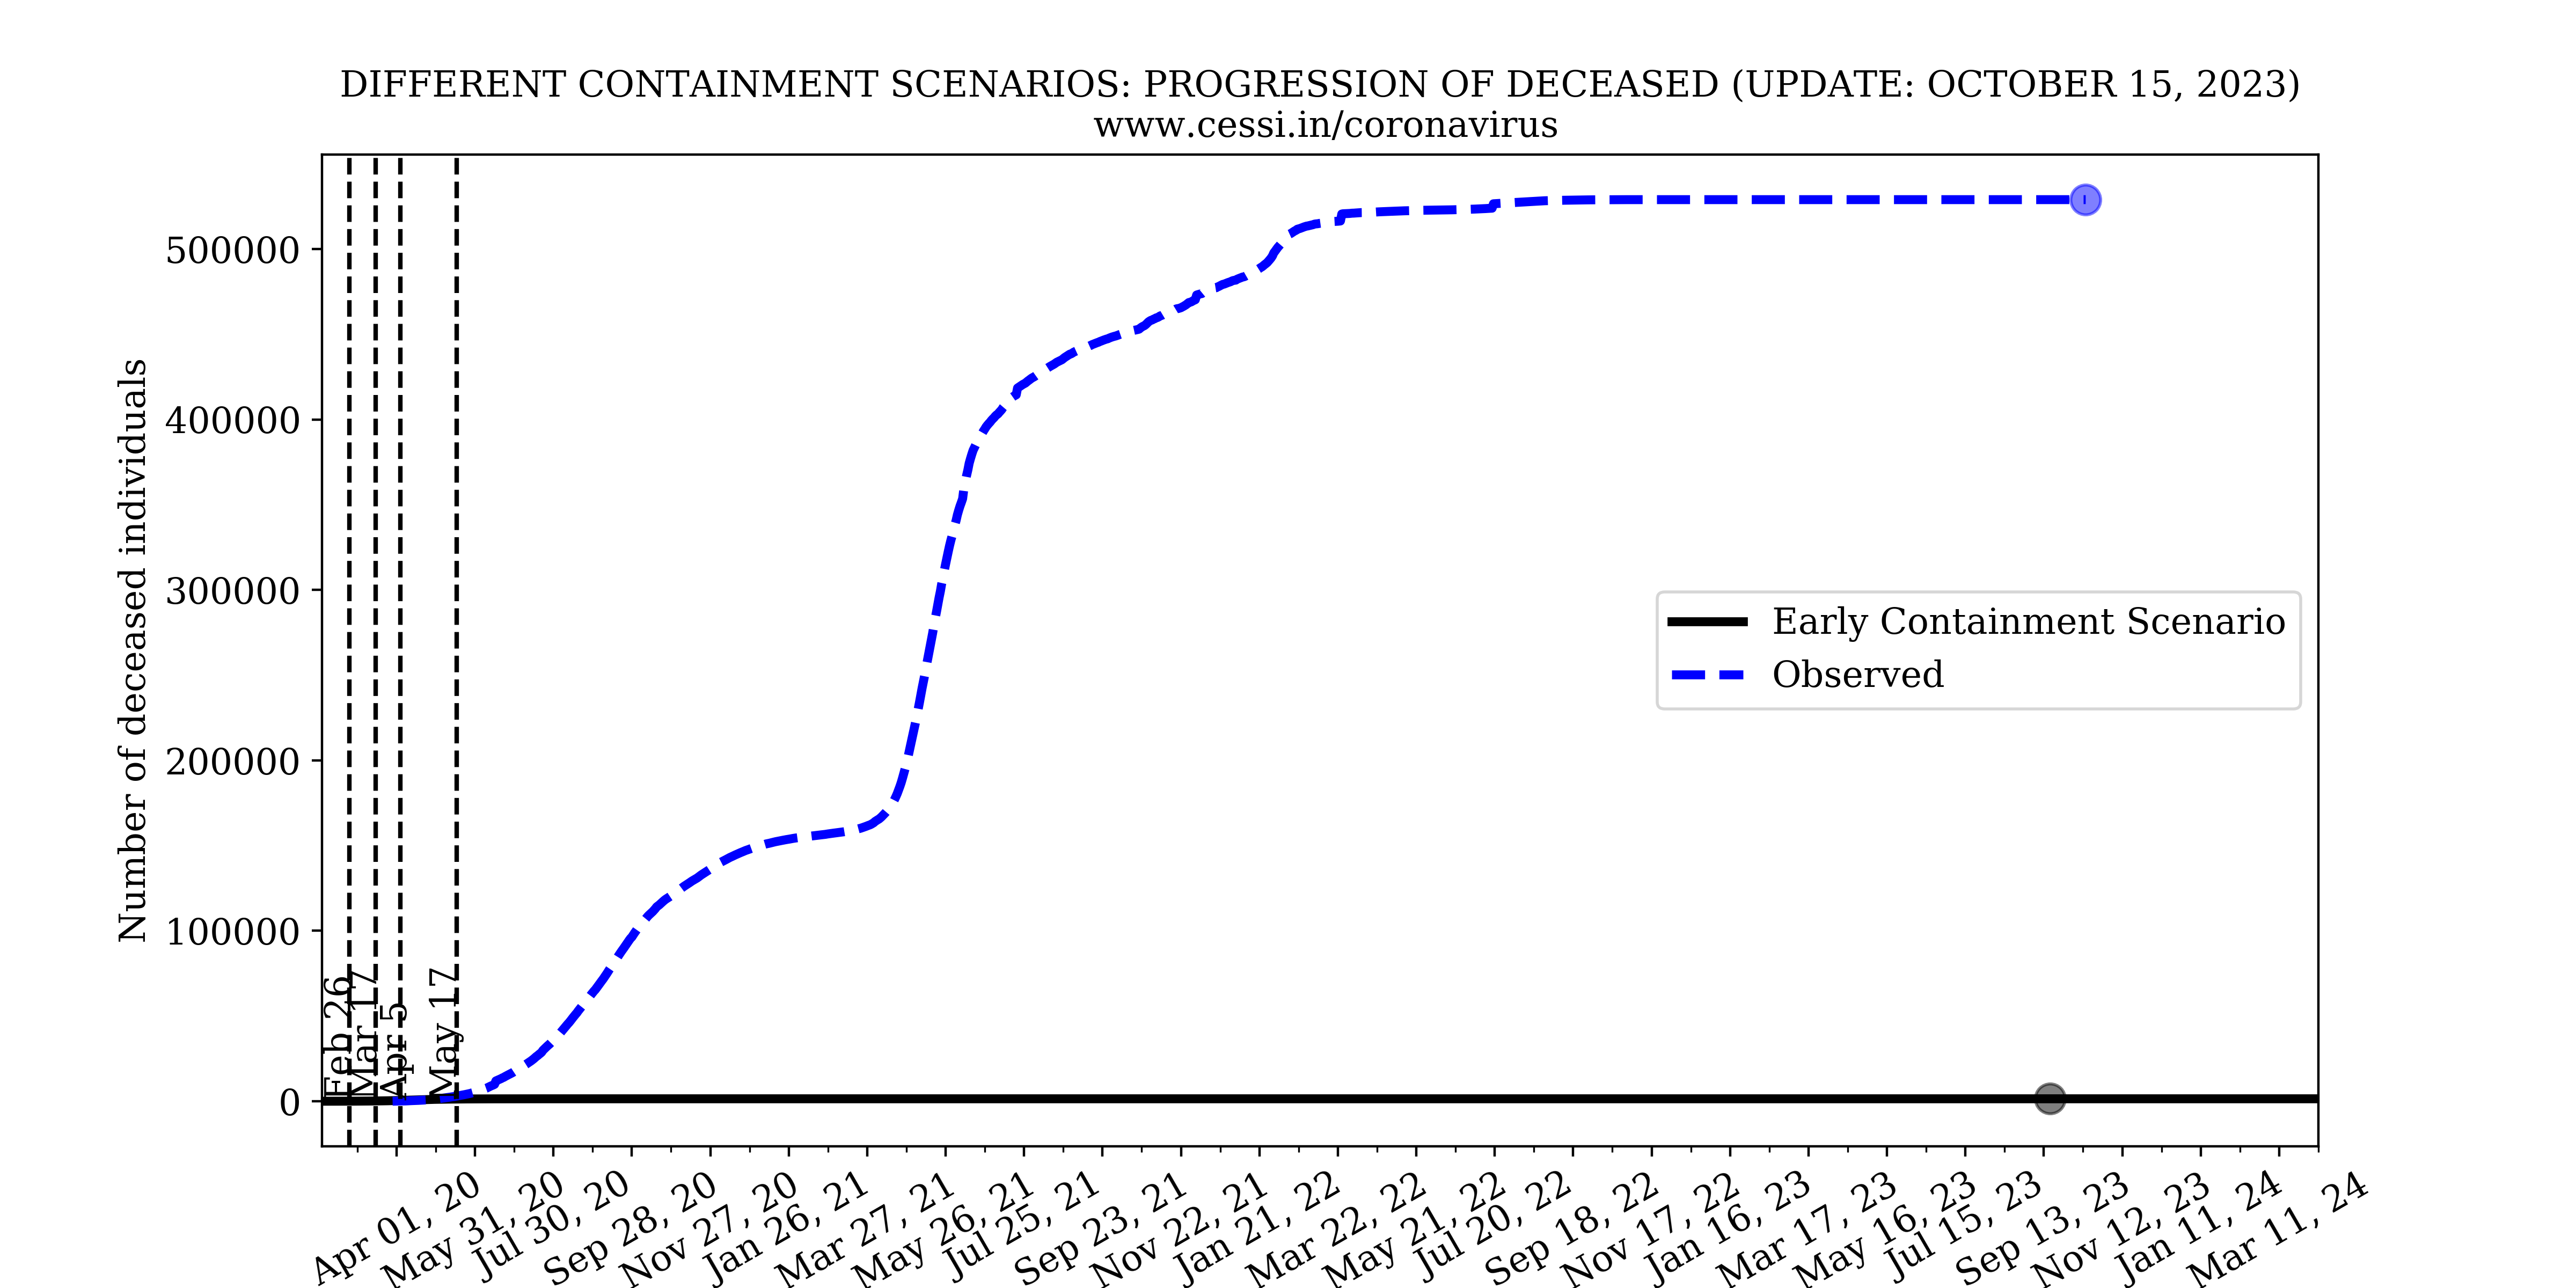
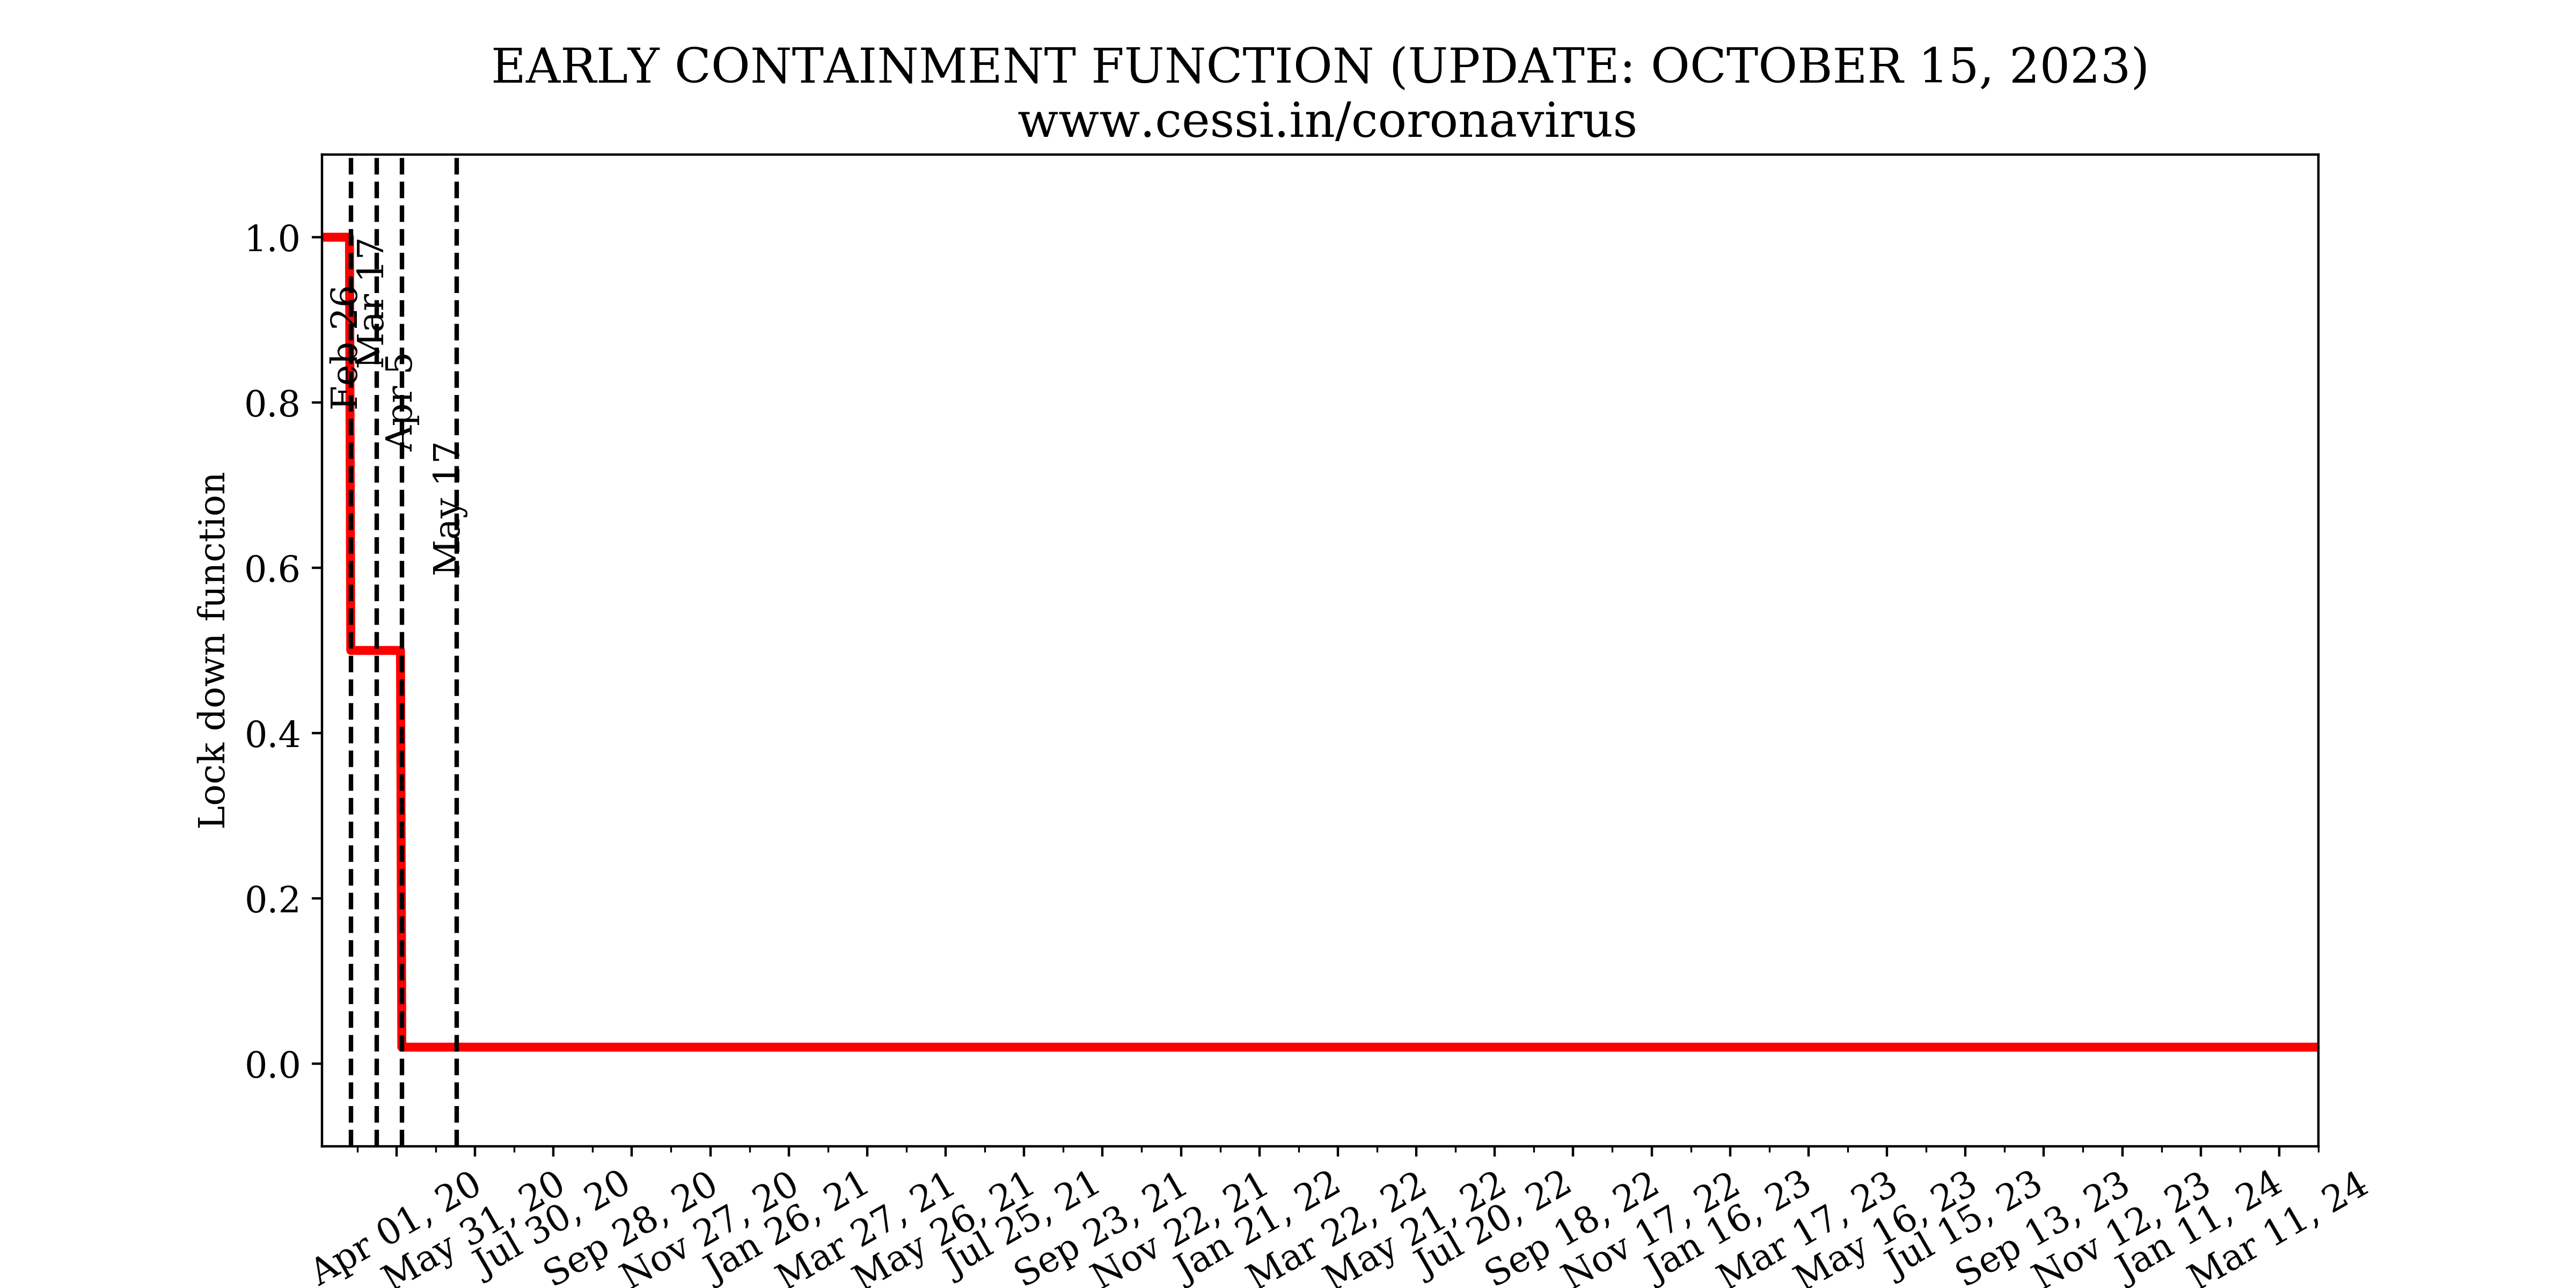
Our model simulations with a lockdown imposed on 26 February 2020, that is a month earlier compared to the actual date of imposition of the Indian lockdown (25 March). This indicates that implementation of an early and strict containment is necessary to control the growth rate of the pandemic. This is because the initial numbers of exposed and infected individuals were lower, and an early imposition of the containment would have contained the disease much more effectively and quickly. However, one must add the caveat that this would still have left a large number of susceptible individuals in the population and only an extended containment until mid-May - even if imposed earlier - would still have been necessary.
6. What is the best strategy for continuing a national lockdown or isolated regional
lockdowns in various parts of India?
We are currently performing research with our epidemiological model - optimized for India -
to figure out a desirable containment strategy that can inform public policy. While we are
exploring various strategies through predictive modeling, our early experience is that there
is no one magic solution. This also indicates the difficulties that confront public policy
makers at central and state levels who must rely on such scientific inputs. As and when we
are able to identify some plausible strategic interventions, we shall make them available to
the nation.
The team involved in this work consists of faculty, graduate and undergraduate students at the Center of Excellence in Space Sciences India (CESSI) and the Department of Physical Sciences at IISER Kolkata.
Modelling: Shaonwita Pal, Soumyaranjan Dash and Dibyendu Nandi
Prof. Dibyendu Nandi
CESSI is funded by the Ministry of Human Resource Development, Government of India under the Frontier Areas of Science and Technology (FAST) Scheme. The research and analysis documented herein utilized the CESSI computational facilities. Soumyaranjan Dash is funded by the INSPIRE program of the Department of Science and Technology, Government of India. Shaonwita Pal is funded by the University Grants Commission, Government of India. Agnibha Banerjee and Vishal Singh are funded by KIshore Vaigyanik Protsahan Yojana of the Department of Science and Technology, Government of India.
MODELLING AND DATA ANALYTICS TEAM
Data Analytics: Agnibha Banerjee, Vishal Singh, Dibyendu Nandi, Rajesh Nayak and Ayan Banerjee.
Webpage: Soumyaranjan Dash, Agnibha Banerjee and Prosenjit Lahiri
CONTACT
dnandi at iiserkol dot ac dot in
ACKNOWLEDGEMENTS