CESSI-nCoV-SEIRD model
Dynamics of a rapidly spreading contagious disease can be studied using simple compartmental models utilizing coupled ordinary differential equations. Recent outbreak of the SARS-CoV-2 has already claimed a significant number of lives and it still remains a highly contagious infection. India being one of the densely populated countries the risk of a severe outbreak is highly probable unless prompt action is taken against controlling the infections. At CESSI we have used the SEIRD (Susceptible-Exposed-Infected-Recovered-Dead) model to observe the variation of individuals in different compartments for the Indian population and the effect of different intervention strategies on the growth rate of the disease. The transitions in between the compartments can be realized from the following block diagram.
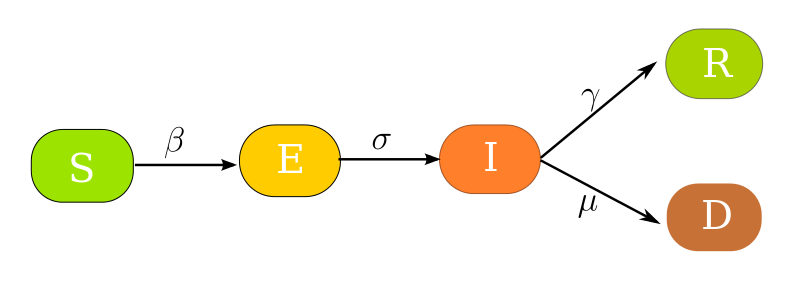
where
- S: Number of susceptible individuals
- E: Number of exposed individuals -- asymptomatic in nature but infectious
- I: Number of infected individuals
- R: Number of individuals who have recovered from the disease and are immune
- D: Number of dead individuals
- Total population of the system is constant and is given by N = S+ E + I + R+ D.
The rate of infection (β) indicates the probability of transmission of the disease from a susceptible to an exposed person. The incubation rate (σ) governs the rate of an asymptomatic individual becoming infectious. The recovery rate (γ) is the average rate at which a person recovers and becomes immune to the disease. Lastly, the mortality rate (μ) governs the death rate of infected individuals who die from the disease. For modelling the dynamics of the COVID19 pandemic we assume,
- Normal birth rate and mortality during this pandemic period does not affect the dynamics.
- After recovery from the disease the person becomes immune to the disease and will never become susceptible again.
- Initially the total population of India is considered to be susceptible.
- The population is assumed to be homogeneous and well mixed with no difference among individuals.
With these assumptions the model equations can be written as,
The severity of the pandemic can be calculated by computing the basic reproduction number (R0). For a fully susceptible population R0 is defined as the number of secondary infections generated by the first infectious individual over the infectious period which is given by R0 = β/(γ + μ). For controlling the pandemic outbreak actions must be taken towards lowering the reproductive number.
The model parameters that we used for the simulations are parameterized to the observed cases in India. In order to implement the effect of the lockdown, we have formulated a containment function, FC(t), which controls the growth rate (β) of the pandemic. The containment function measures the cumulative impact of lockdowns and containment measures such as testing, contact tracing, isolation, and quarantining. For our standard scenario we define the containment function as,
Indian Government announced two phases of lockdown until now. The first phase of the lockdown spanned over 21 days starting from 25th March 2020. In the next phase it is extended until 3rd May totaling a period of 40 days. We started our simulations from 1st March to study the spread of the disease qualitatively. We assume that the total population of the country is susceptible initially. As the containment scenario is not ideal for India, we took the above containment function and fixed the other set of parameters to be β= 0.34/day, σ= 0.1/day, γ= 0.06/day and μ= 0.005/day. The initial population of different compartments are set to be S(t=0)=N= 1.3526*109, I(t=0)= 3, R(t=0)=3 and D(t=0)=0. We also explored the compartmental dynamics by varying the growth rate and population of initially exposed persons. The resulting plots can be found on the Home page.
PARAMETER SPACE STUDIES
Effect of sample size on prediction results
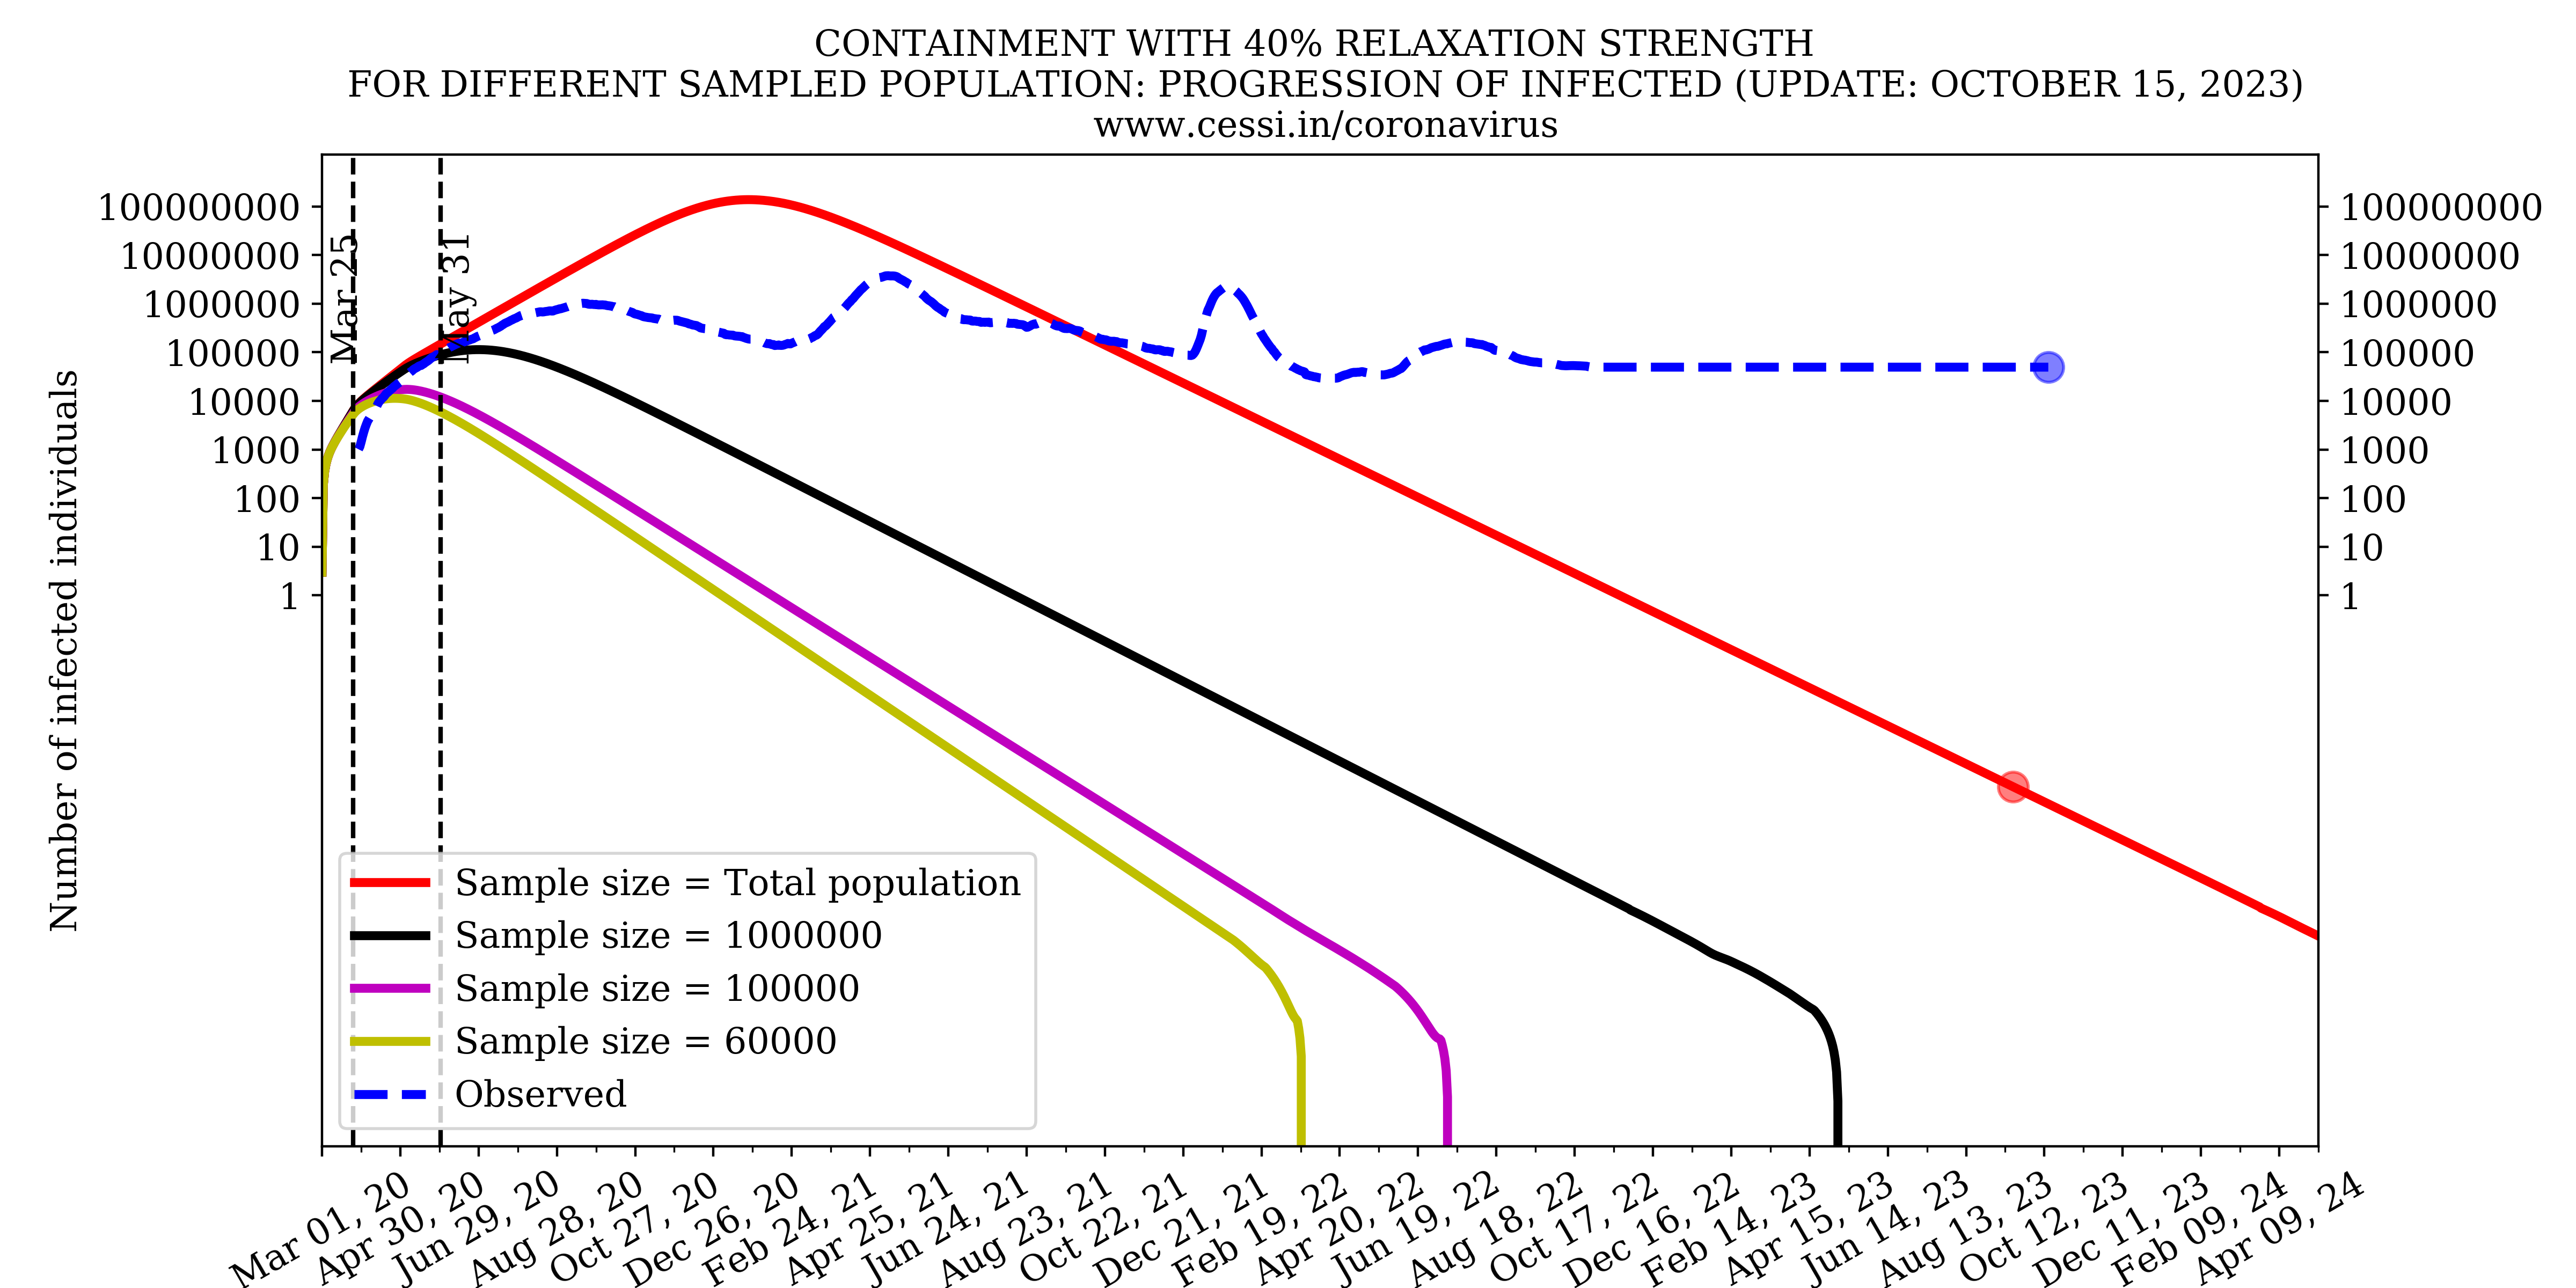
SEIRD type epidemiological models are dependent on the choice of initial condition and model parameters. To understand the dependence of the sample size on the model prediction, we simulated our standard scenario with different size of initial population of the country. This plot indicates that the undersampling of the initial population will critically affect the model prediction.
Doubling time variation
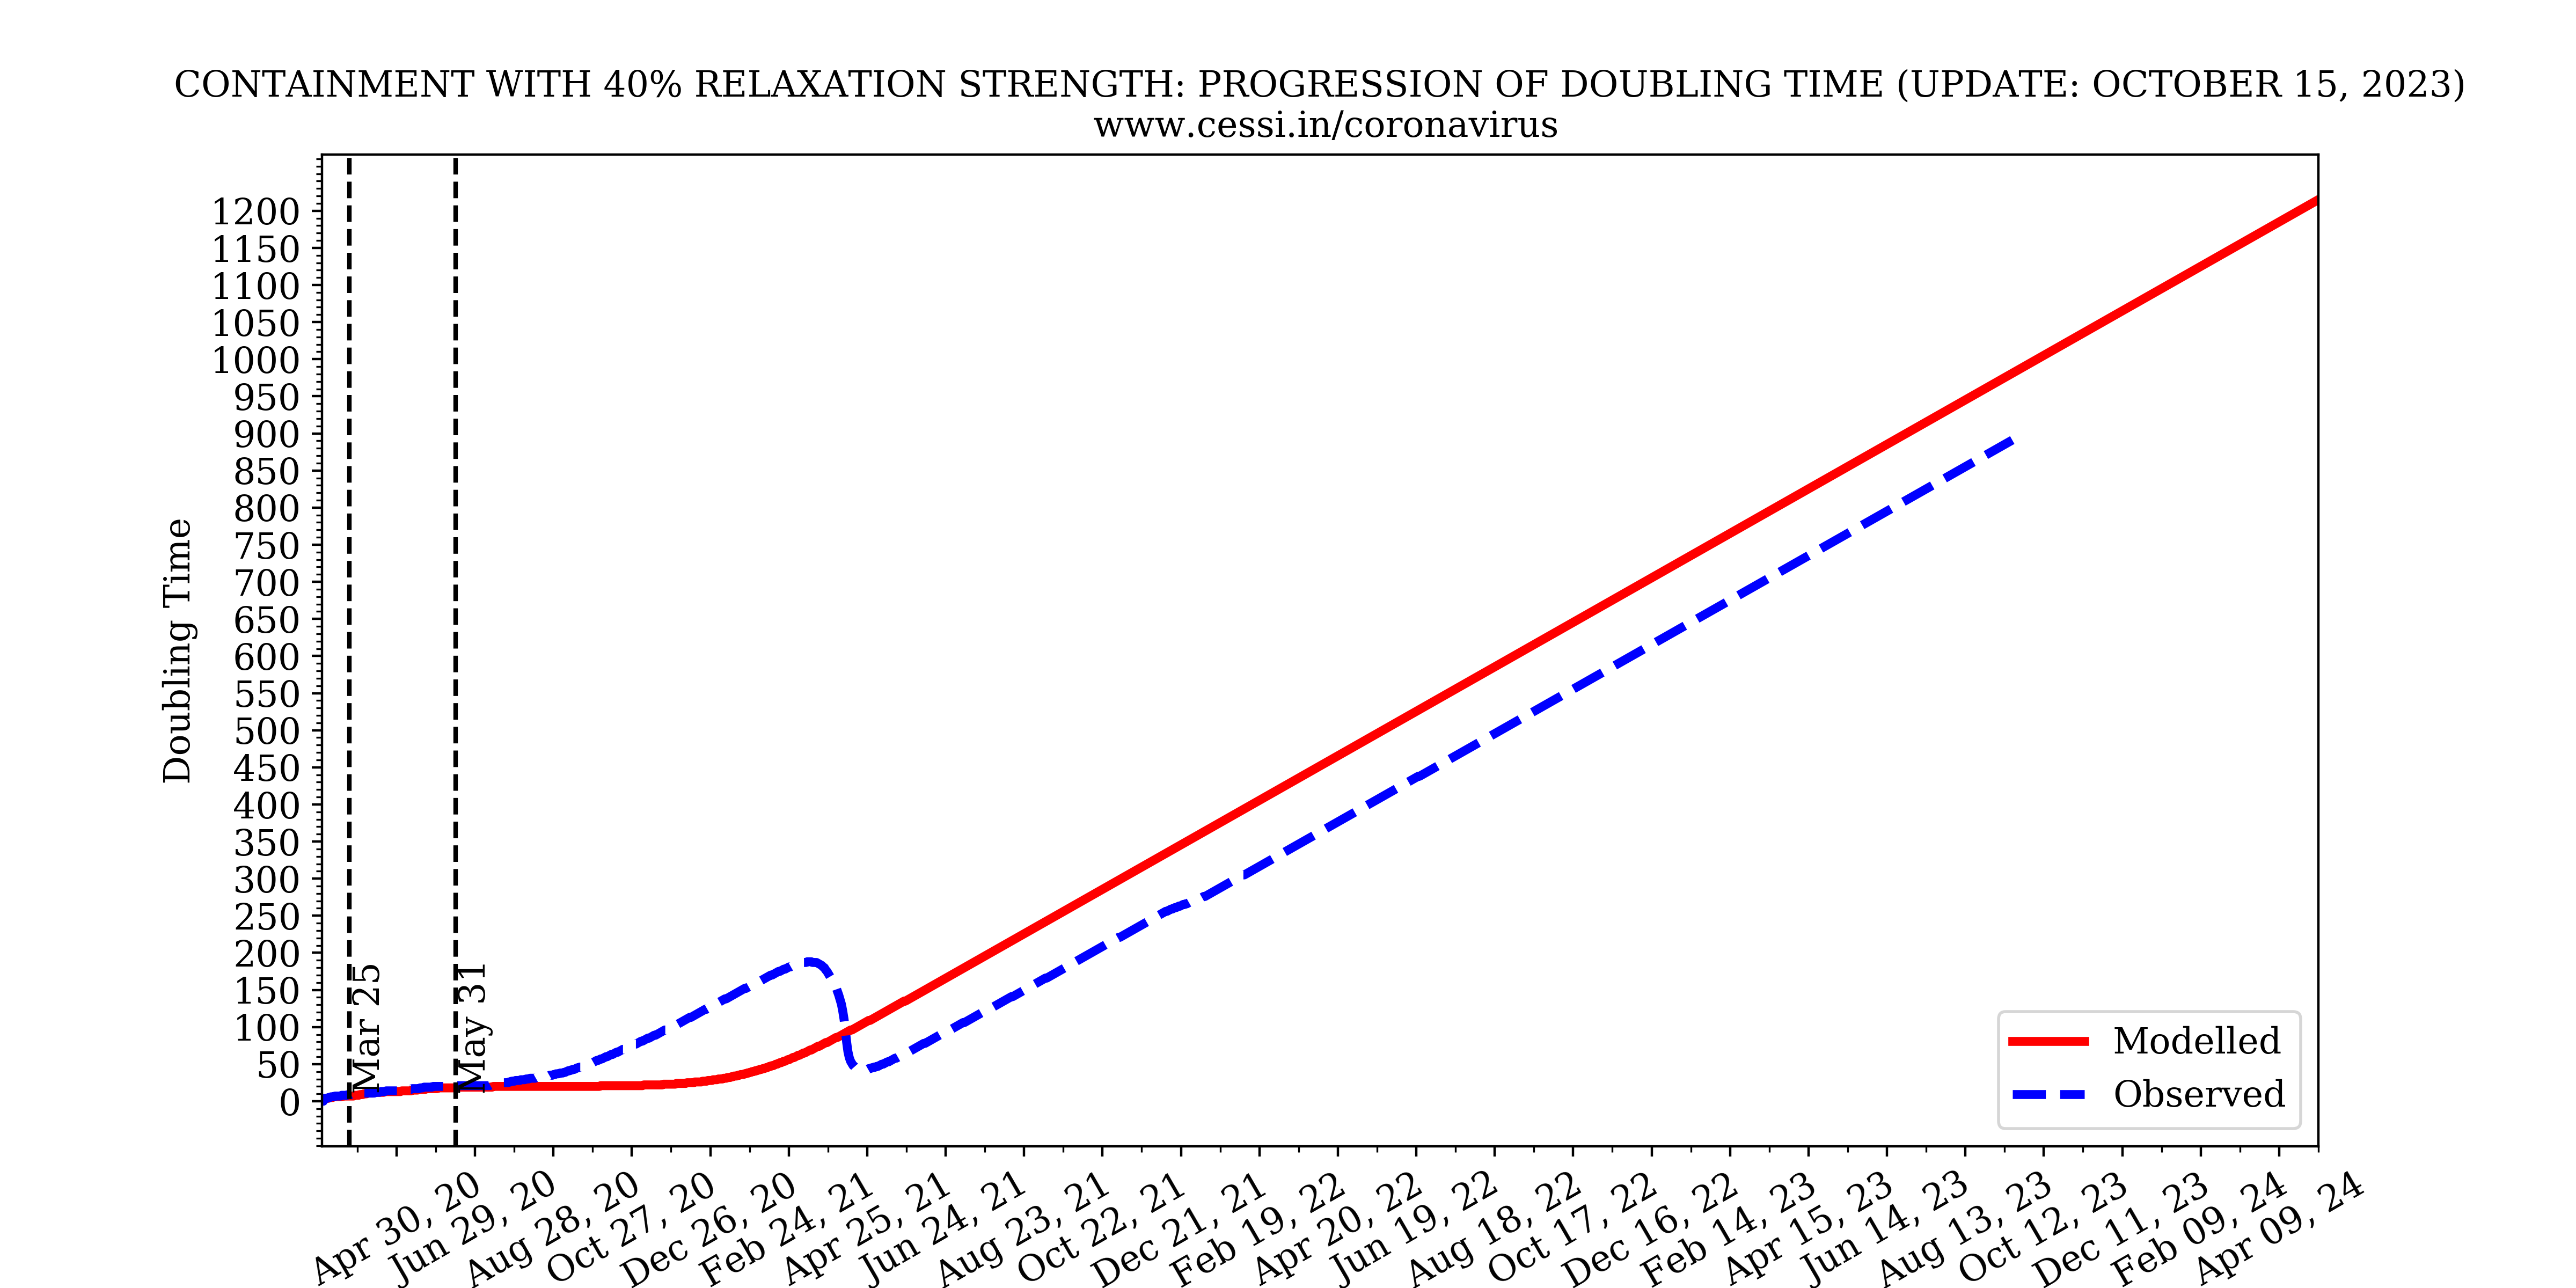
The amount of time taken for the number of infected individuals to double itself is known as Doubling time. Here is an example how the doubling time is calculated. If on day 14 the number of confirmed cases is 100 and it doubled up from 50 on day 2, then doubling time for this case is 12 days which is assigned to day 14 on the curve. In the above plot we show the temporal variation of our model predicted doubling time in a scenario where containment strength is at 70% and the observed data.
Evolution of all compartments with different containment strengths
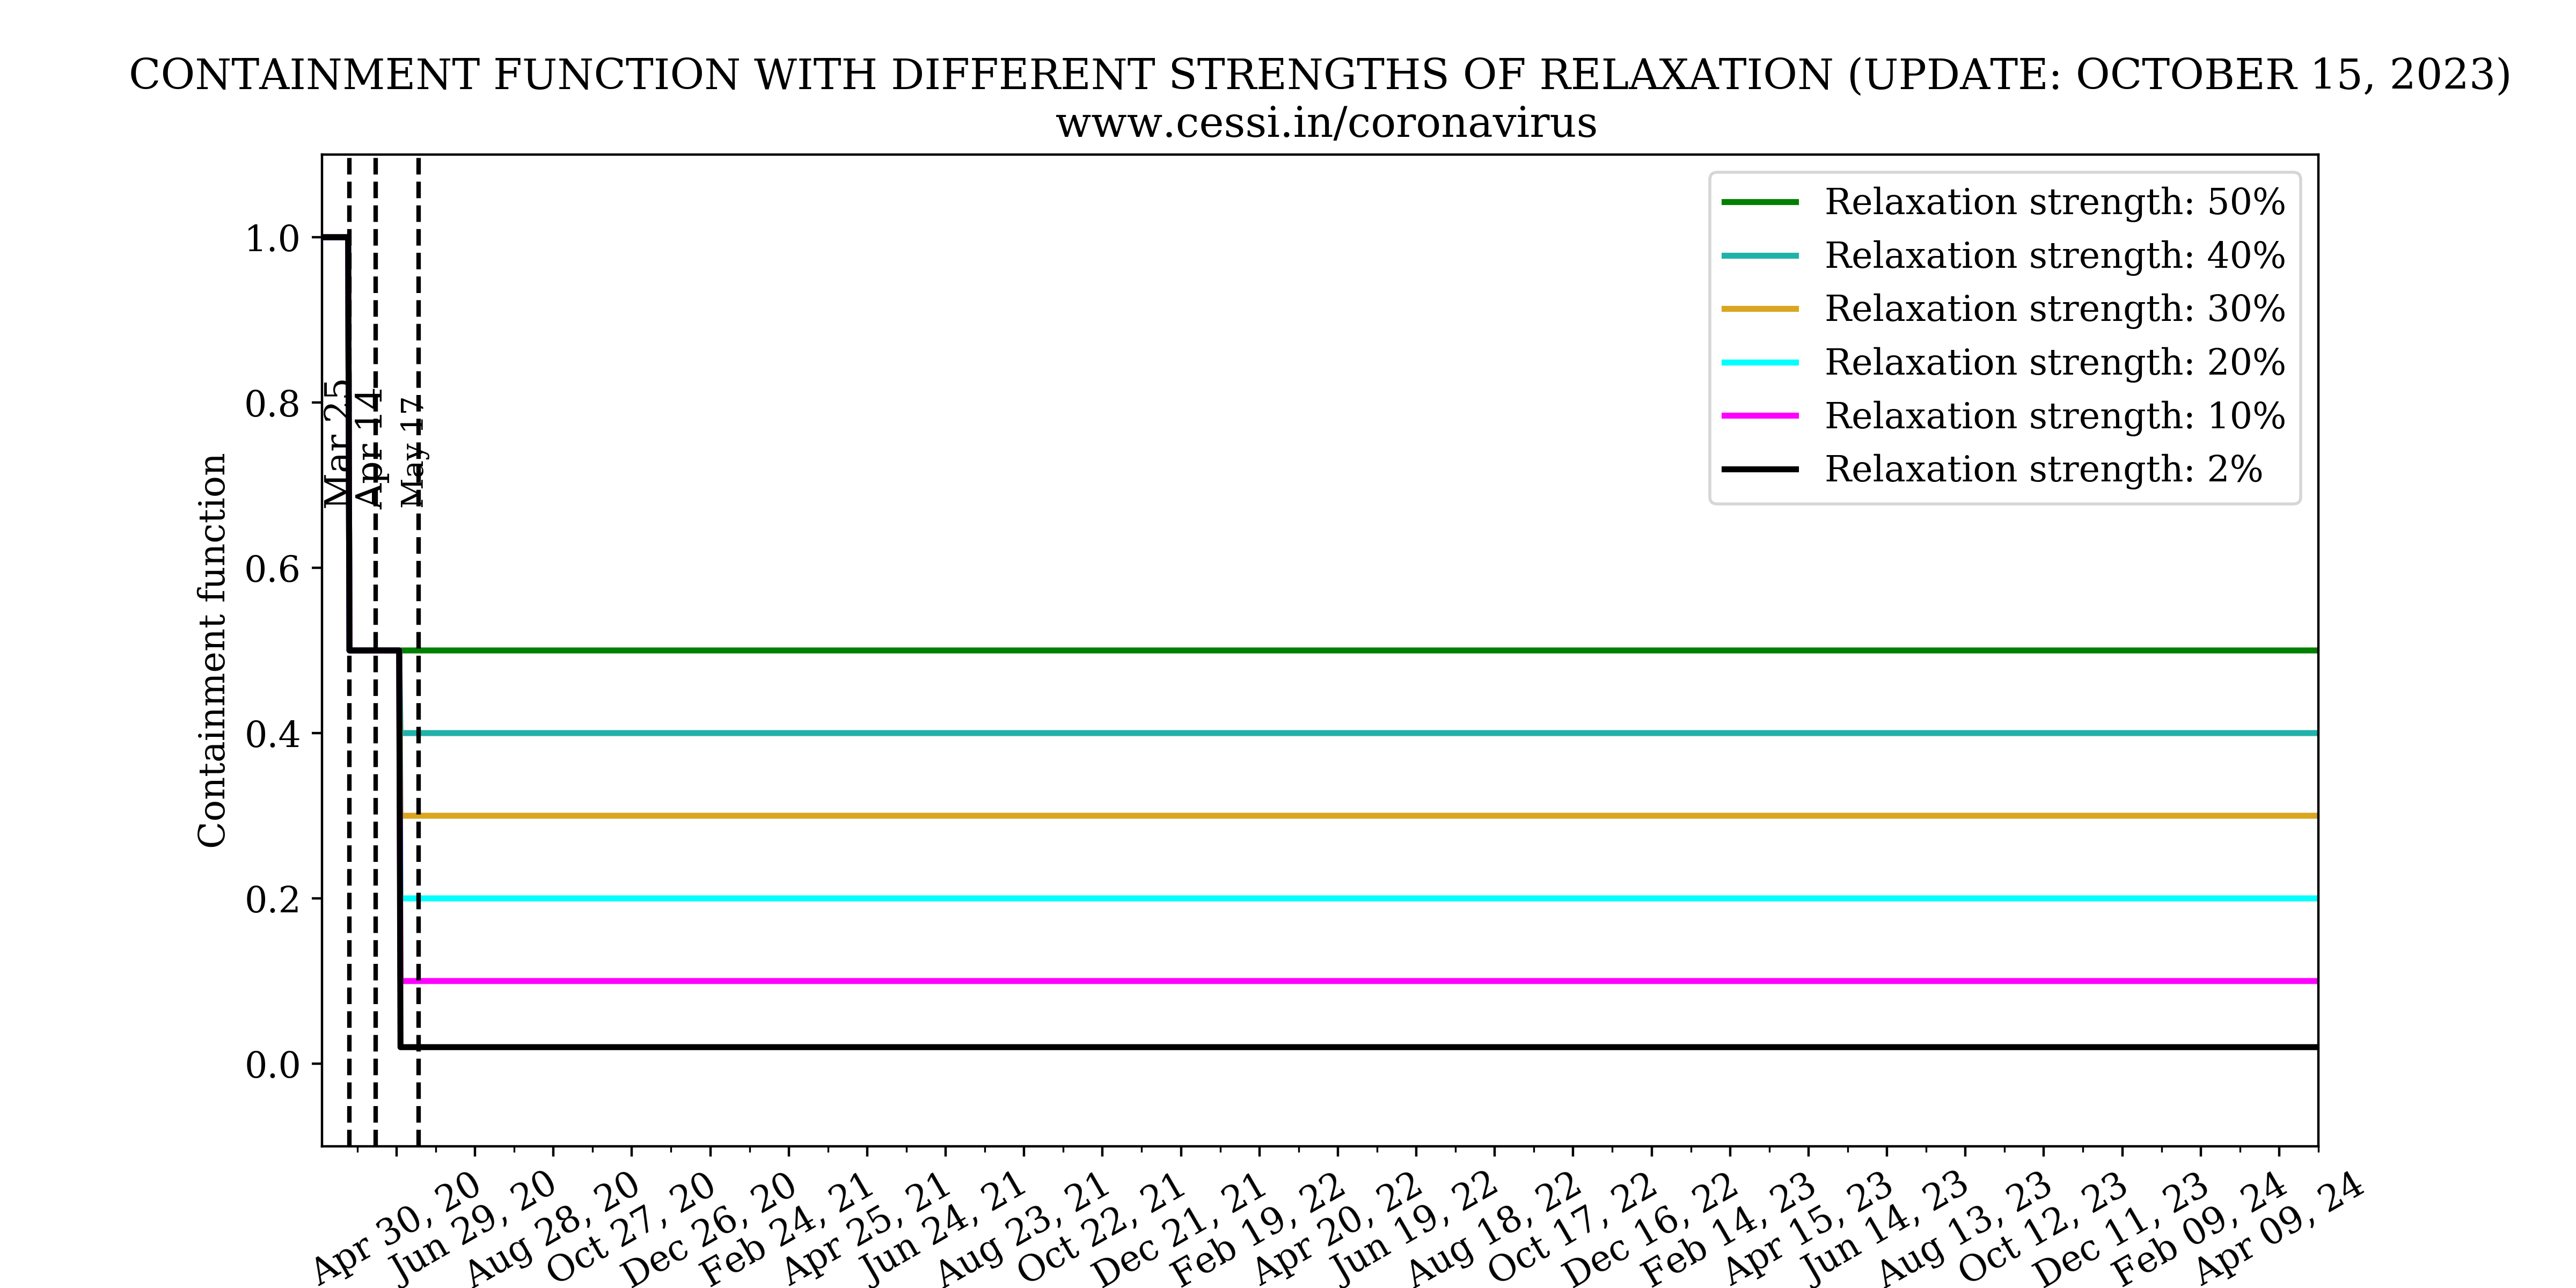
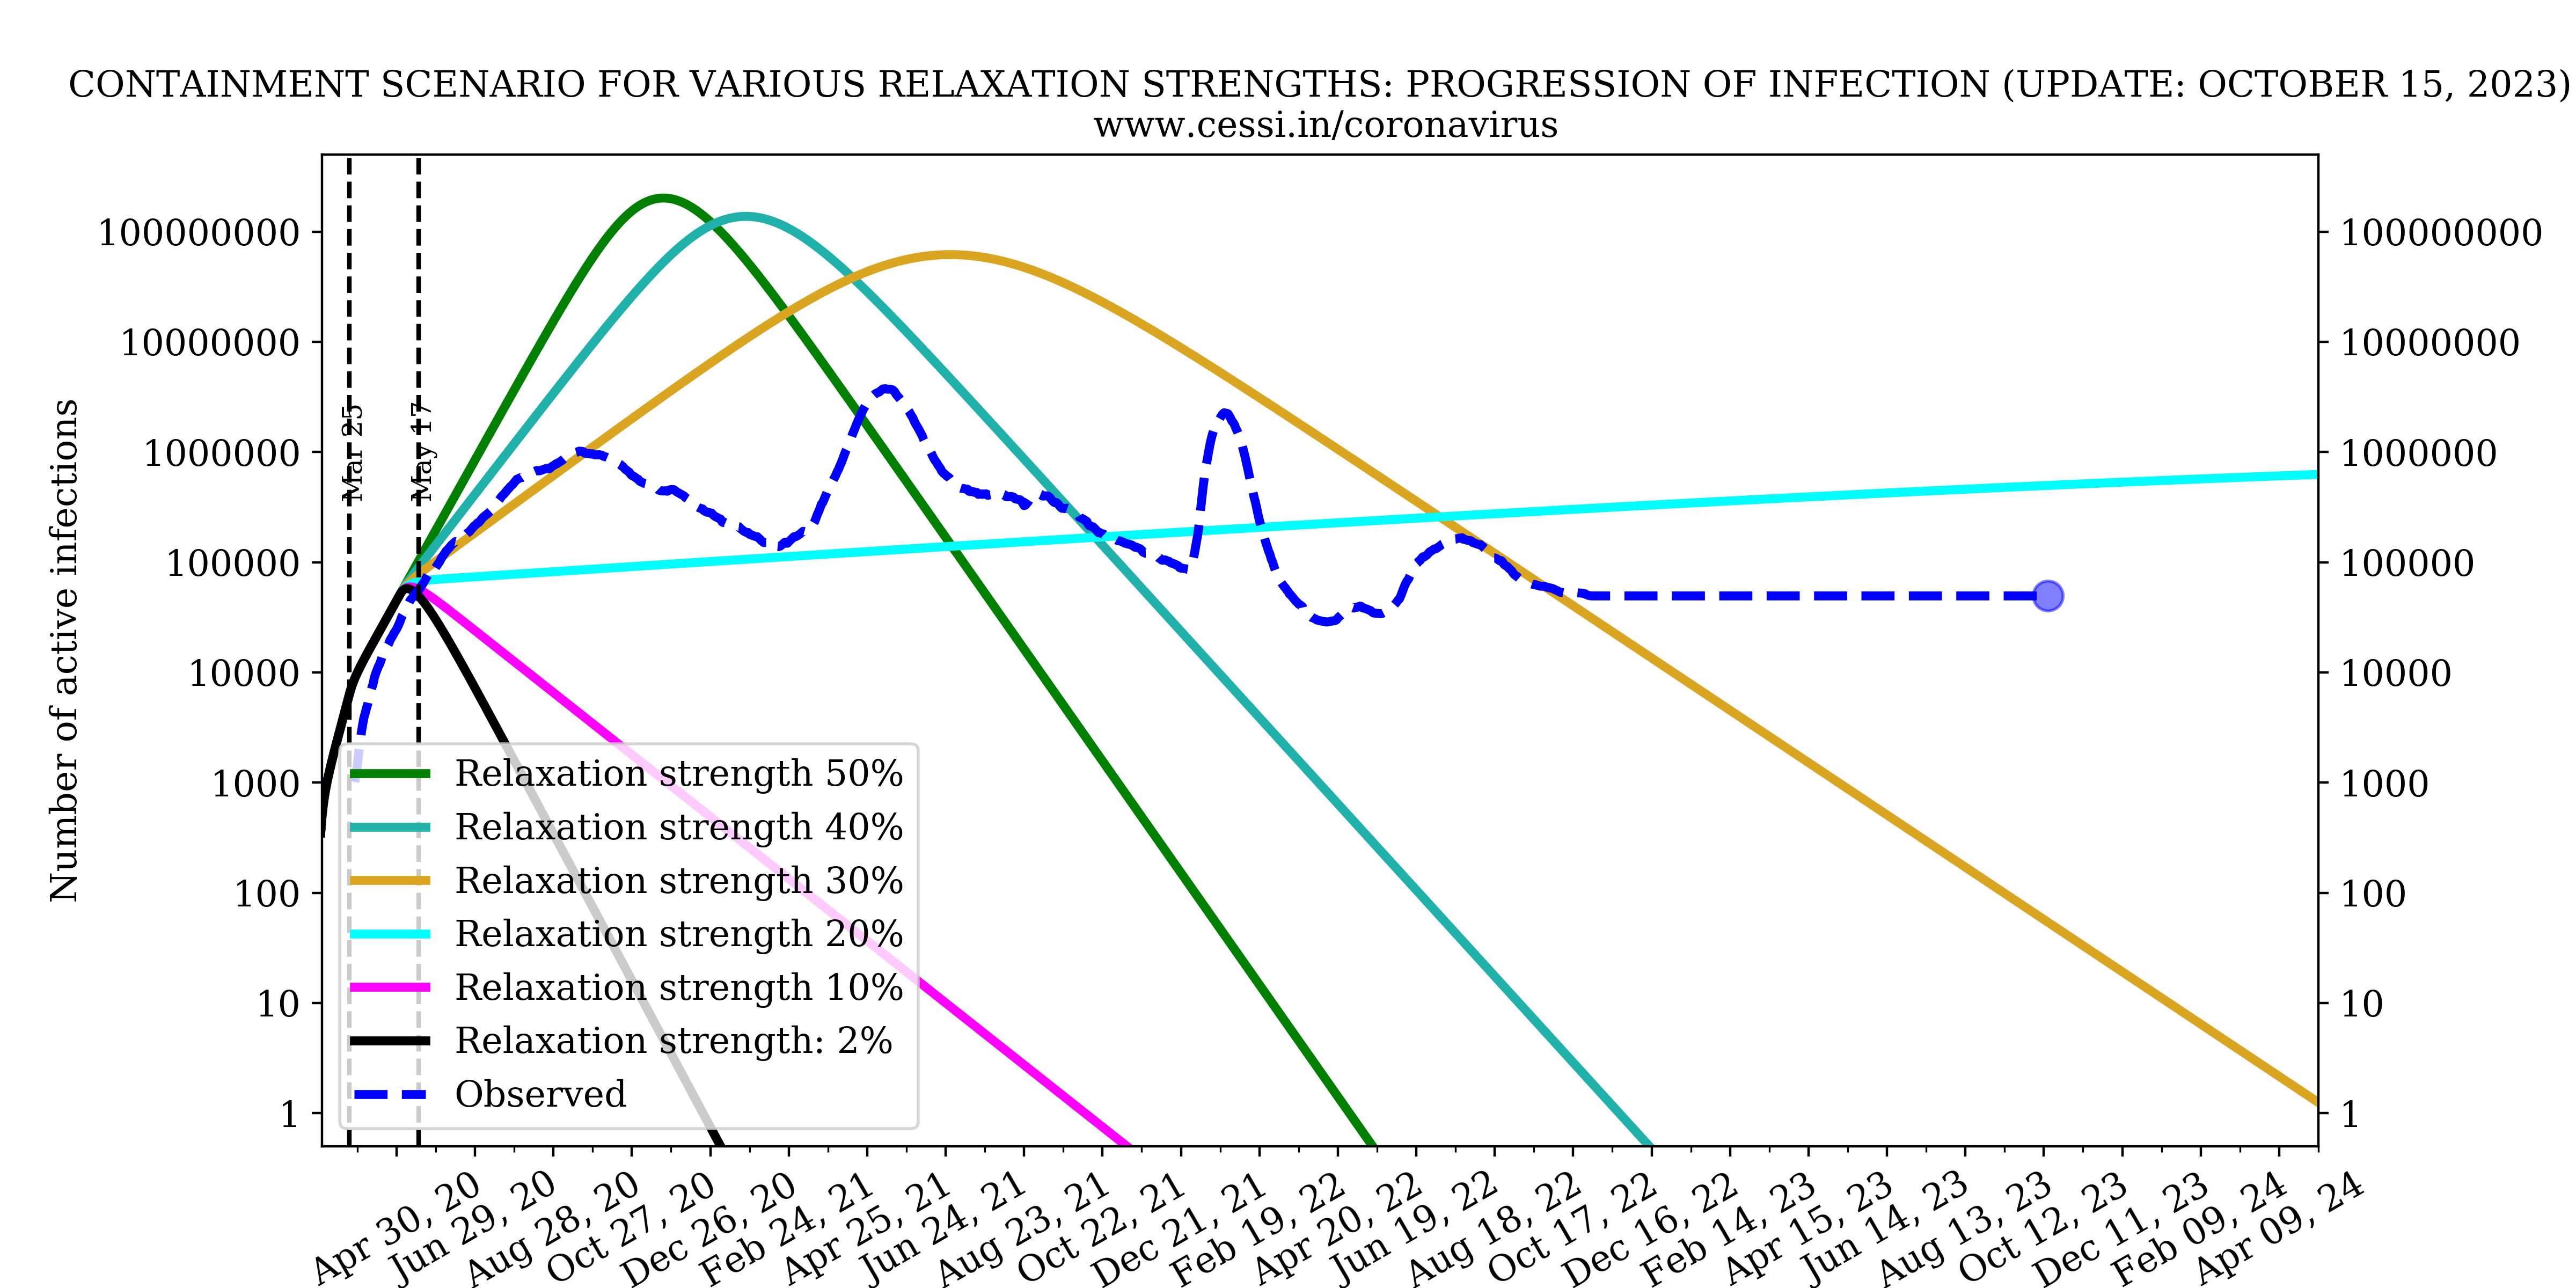
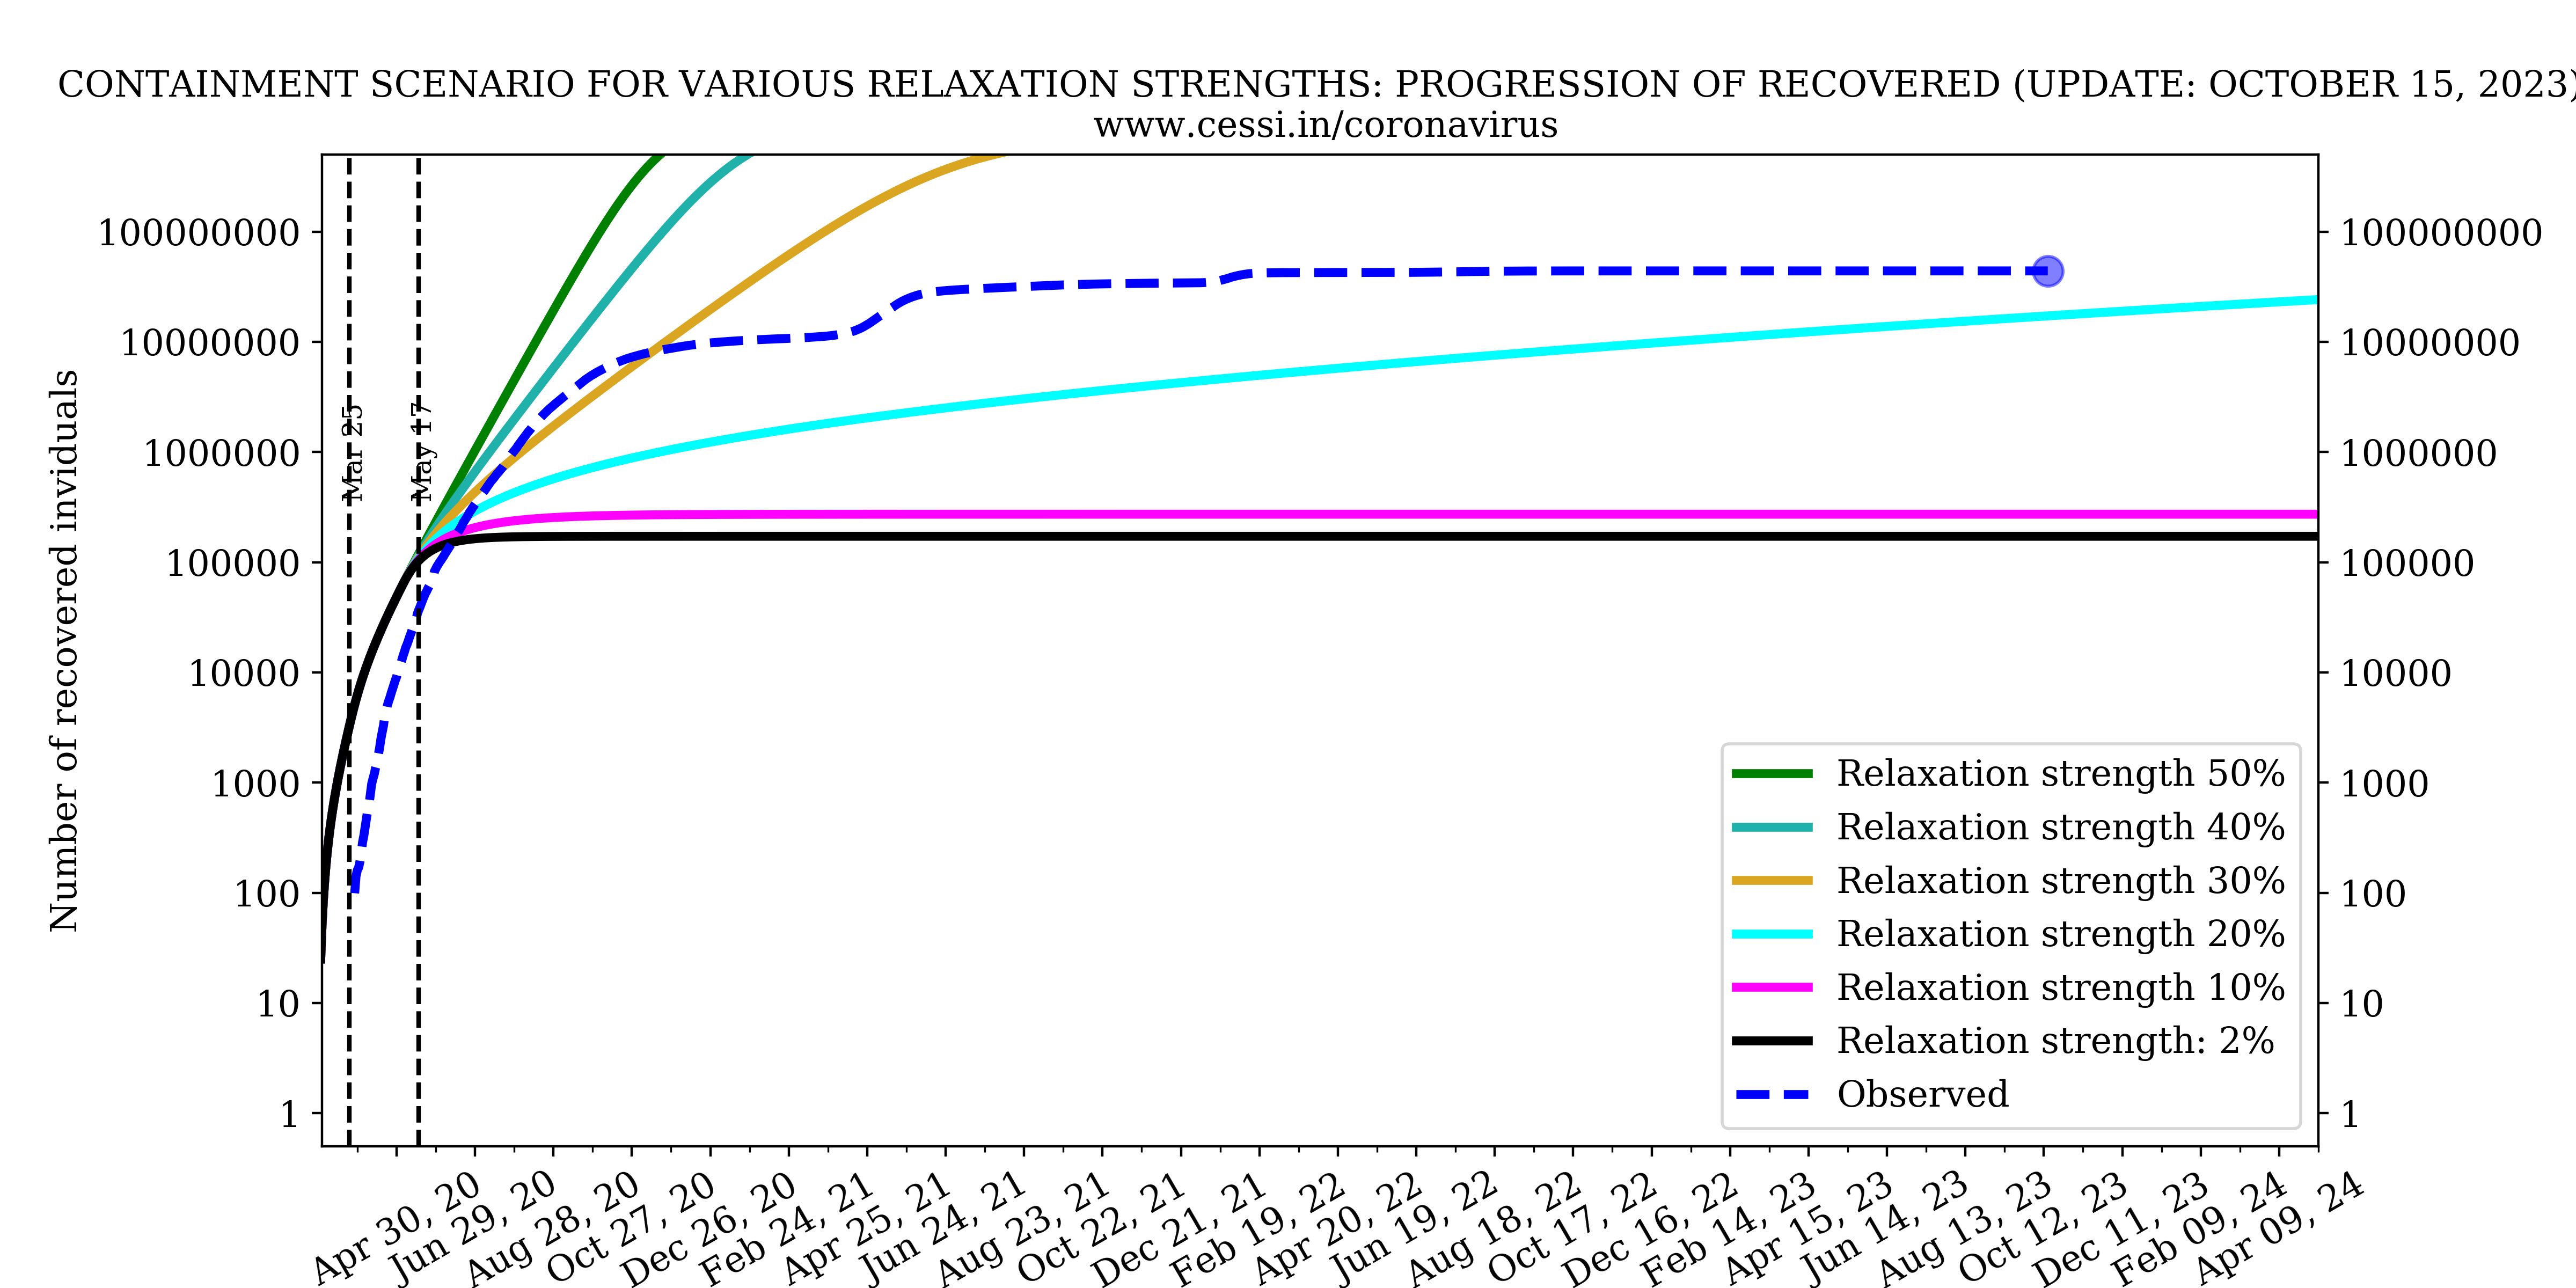
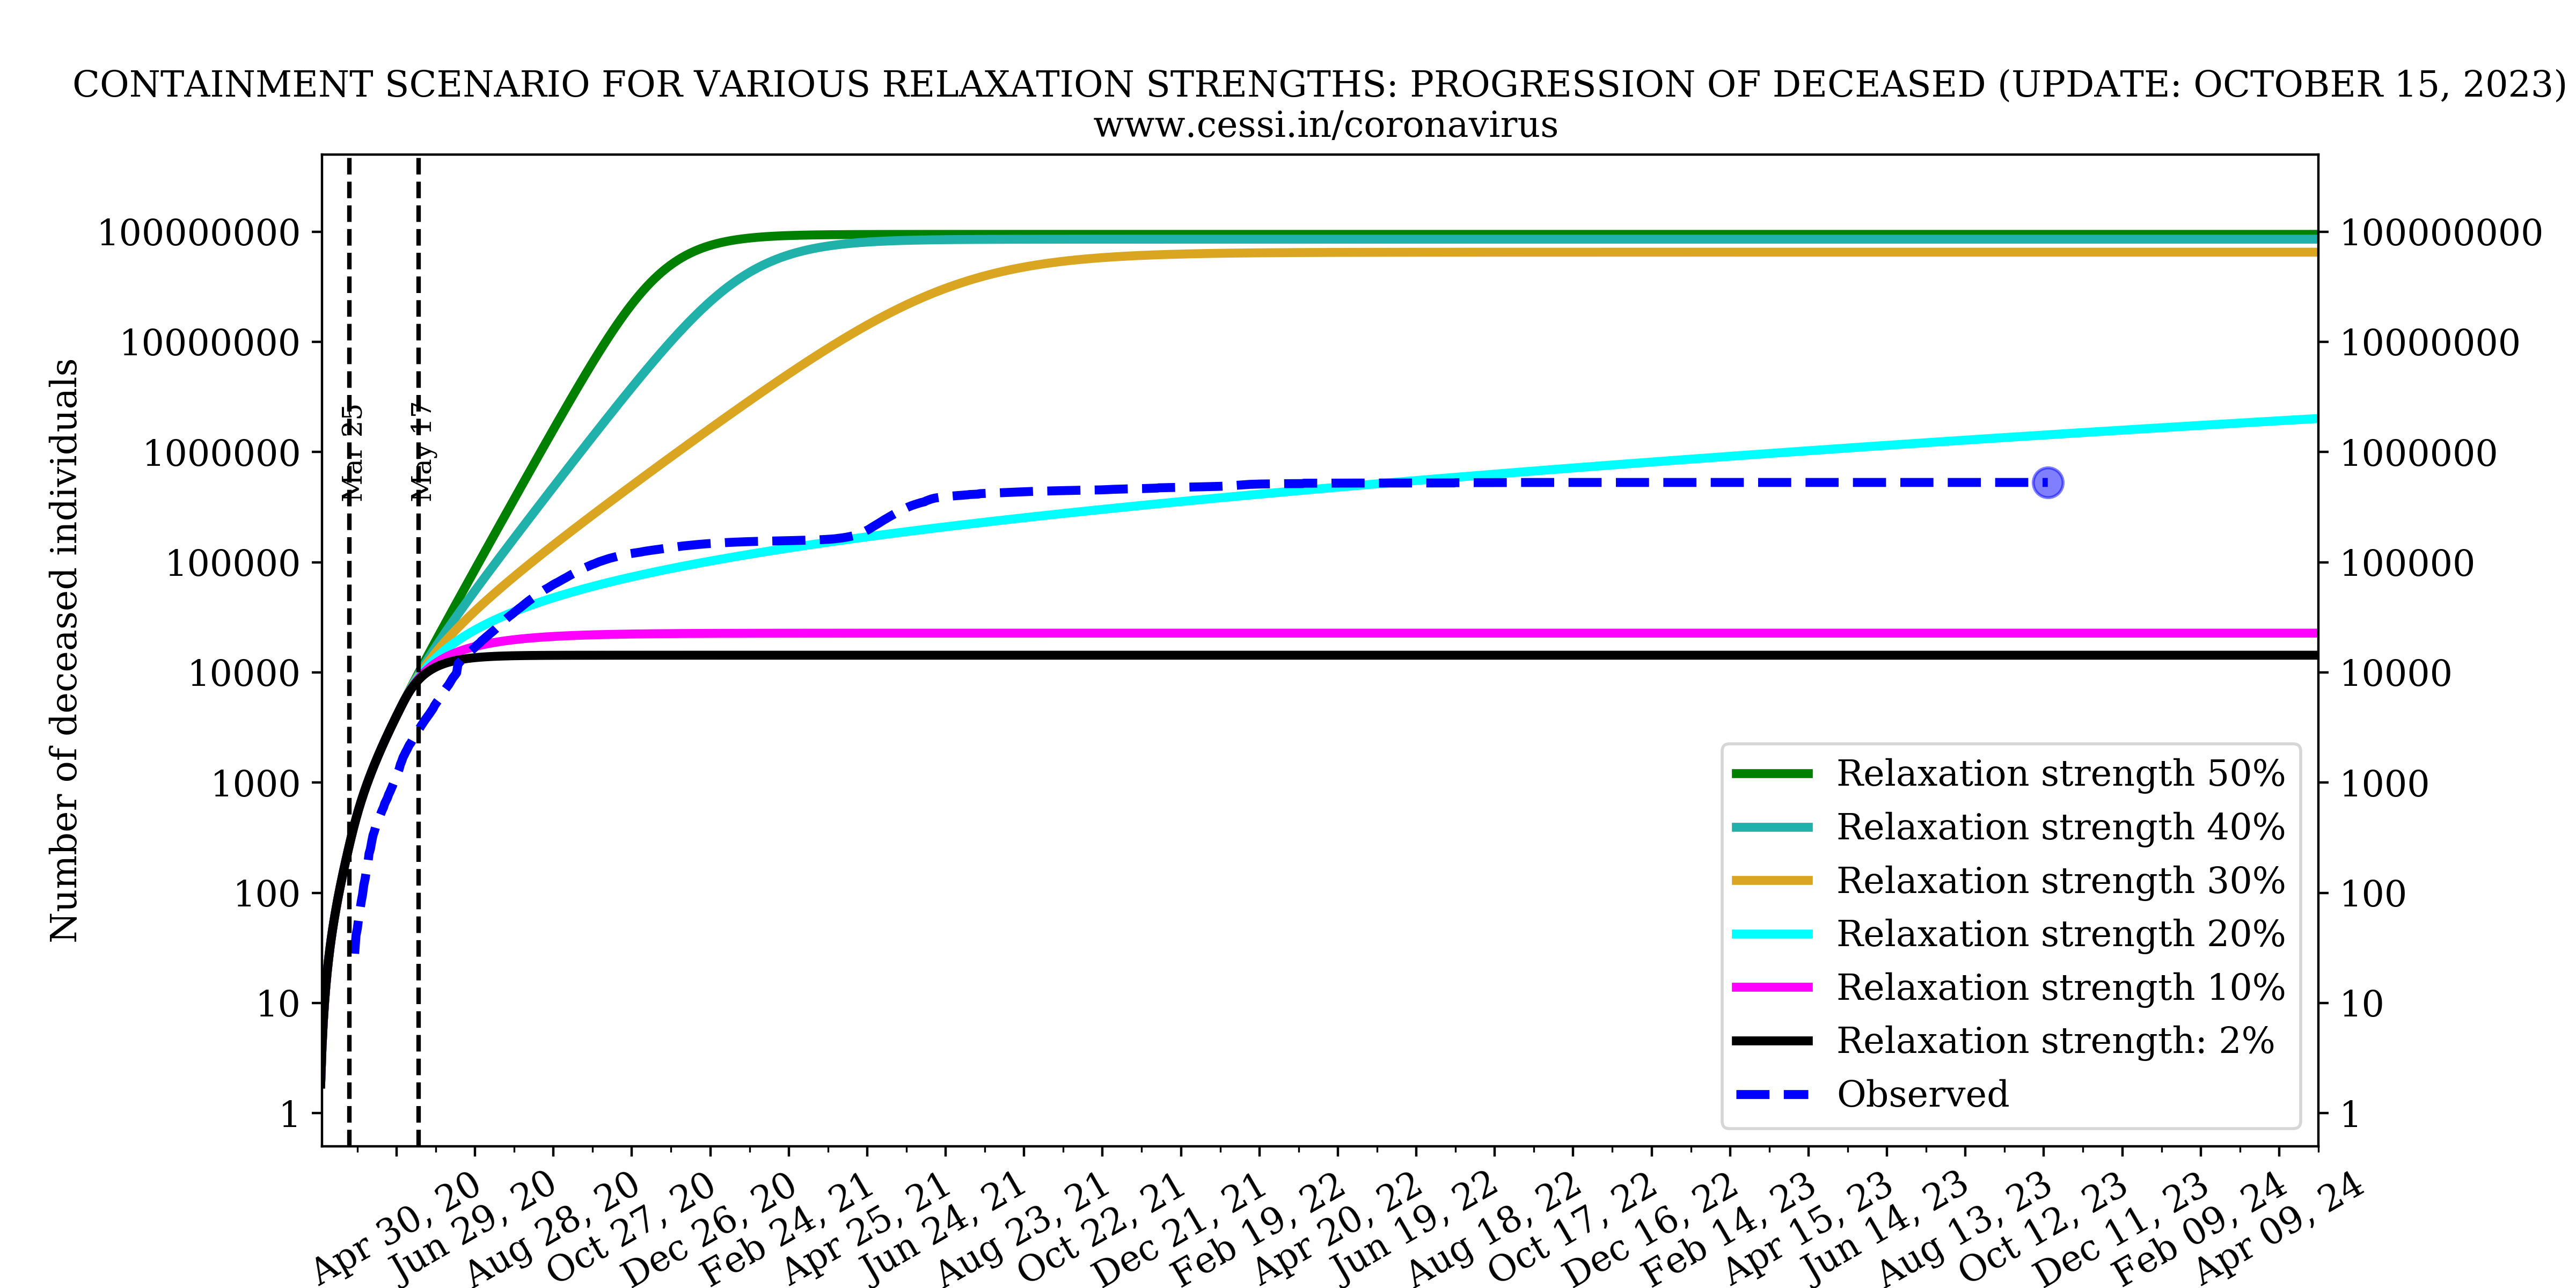
In this panel we show the variation of number of infected, recovered and deceased individuals with different containment strengths.
New infected and recovered individuals

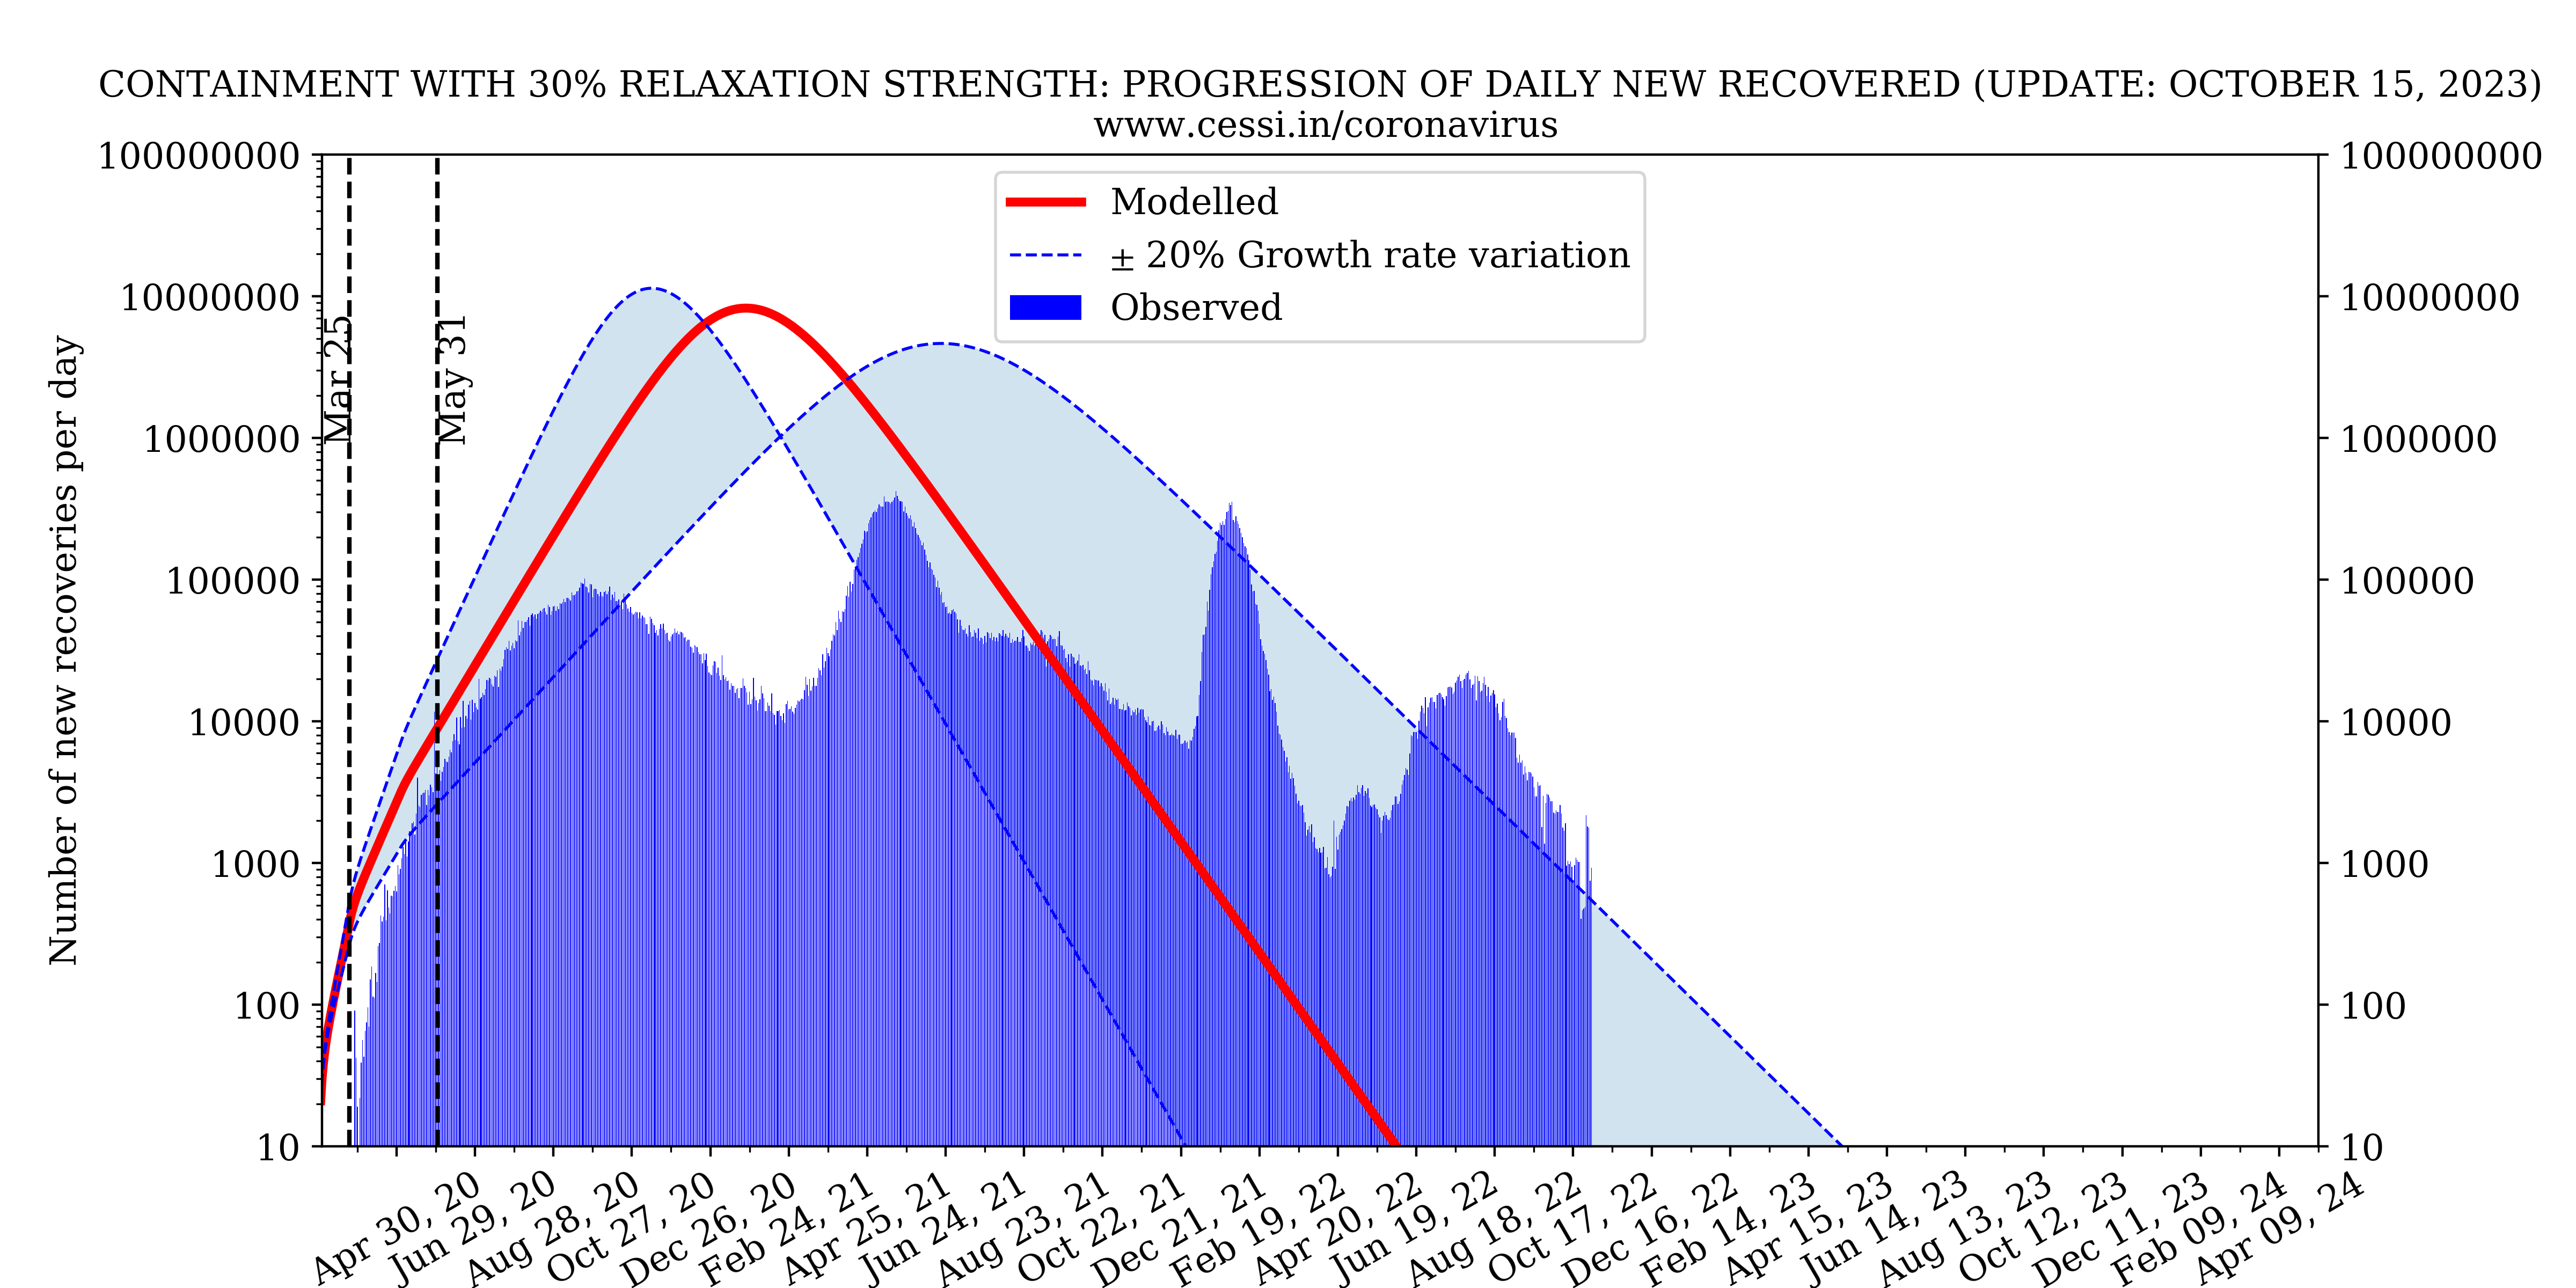
Here is a comparison of the number of new infected and recovered individuals per day from observation and our model prediction.
Growth rate of the disease
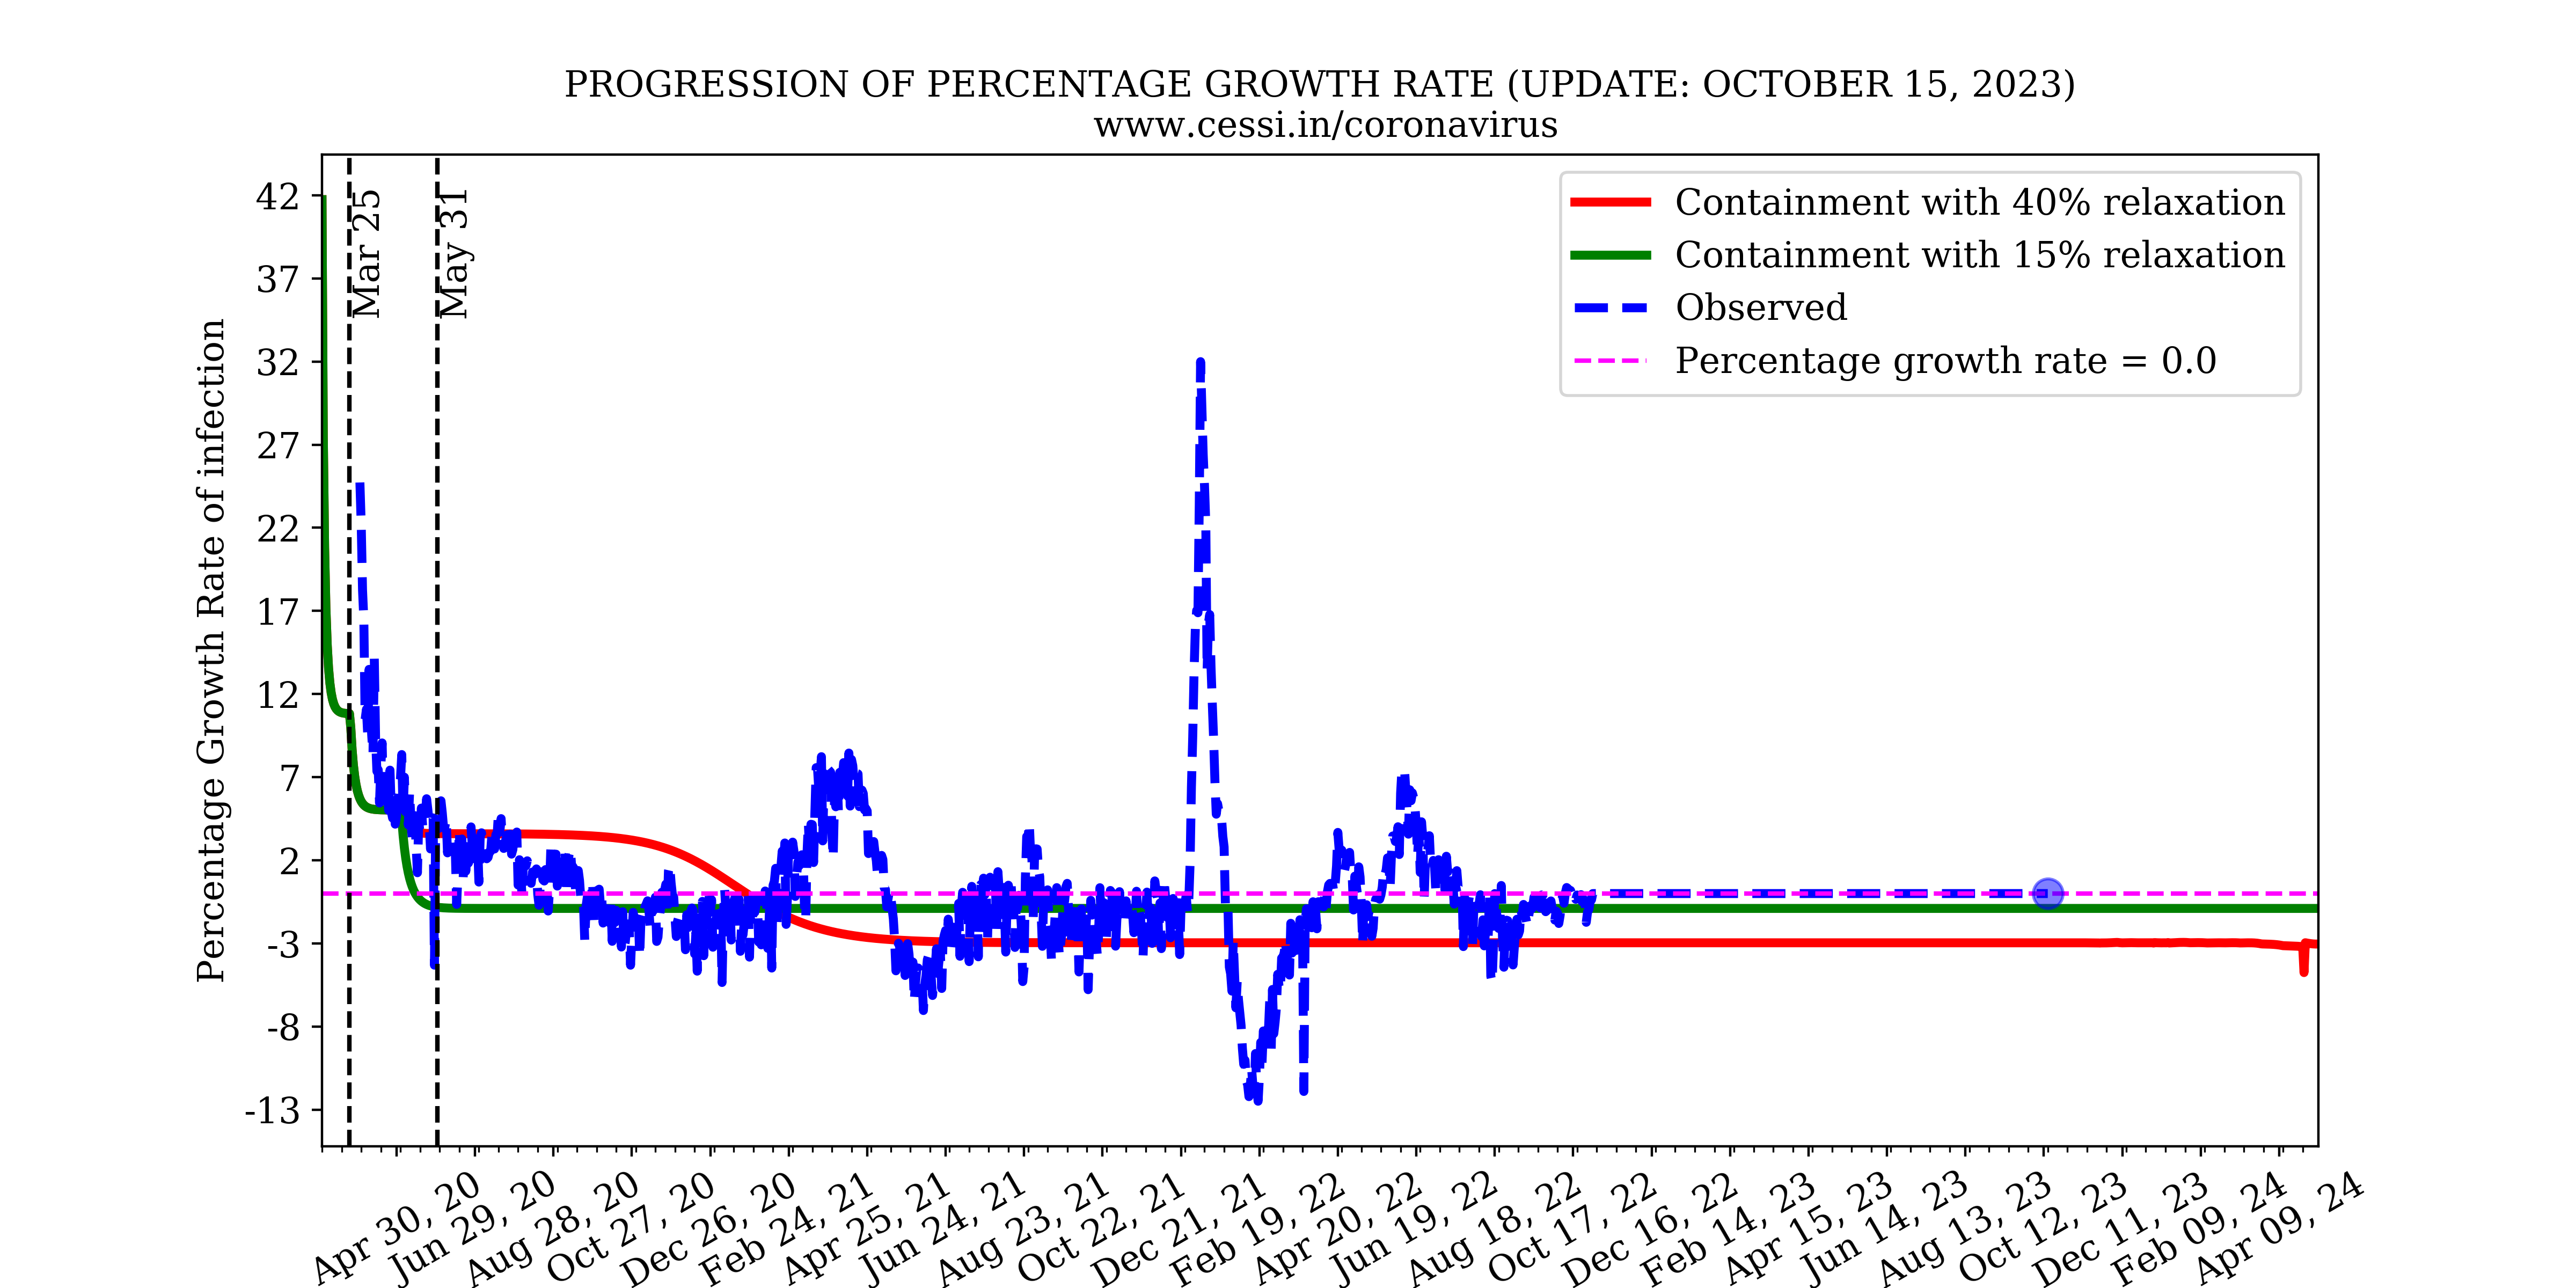
The growth rate of the disease is compared from model and observations to understand the dynamics of the pandemic in Indian context.
Progression of reproduction number
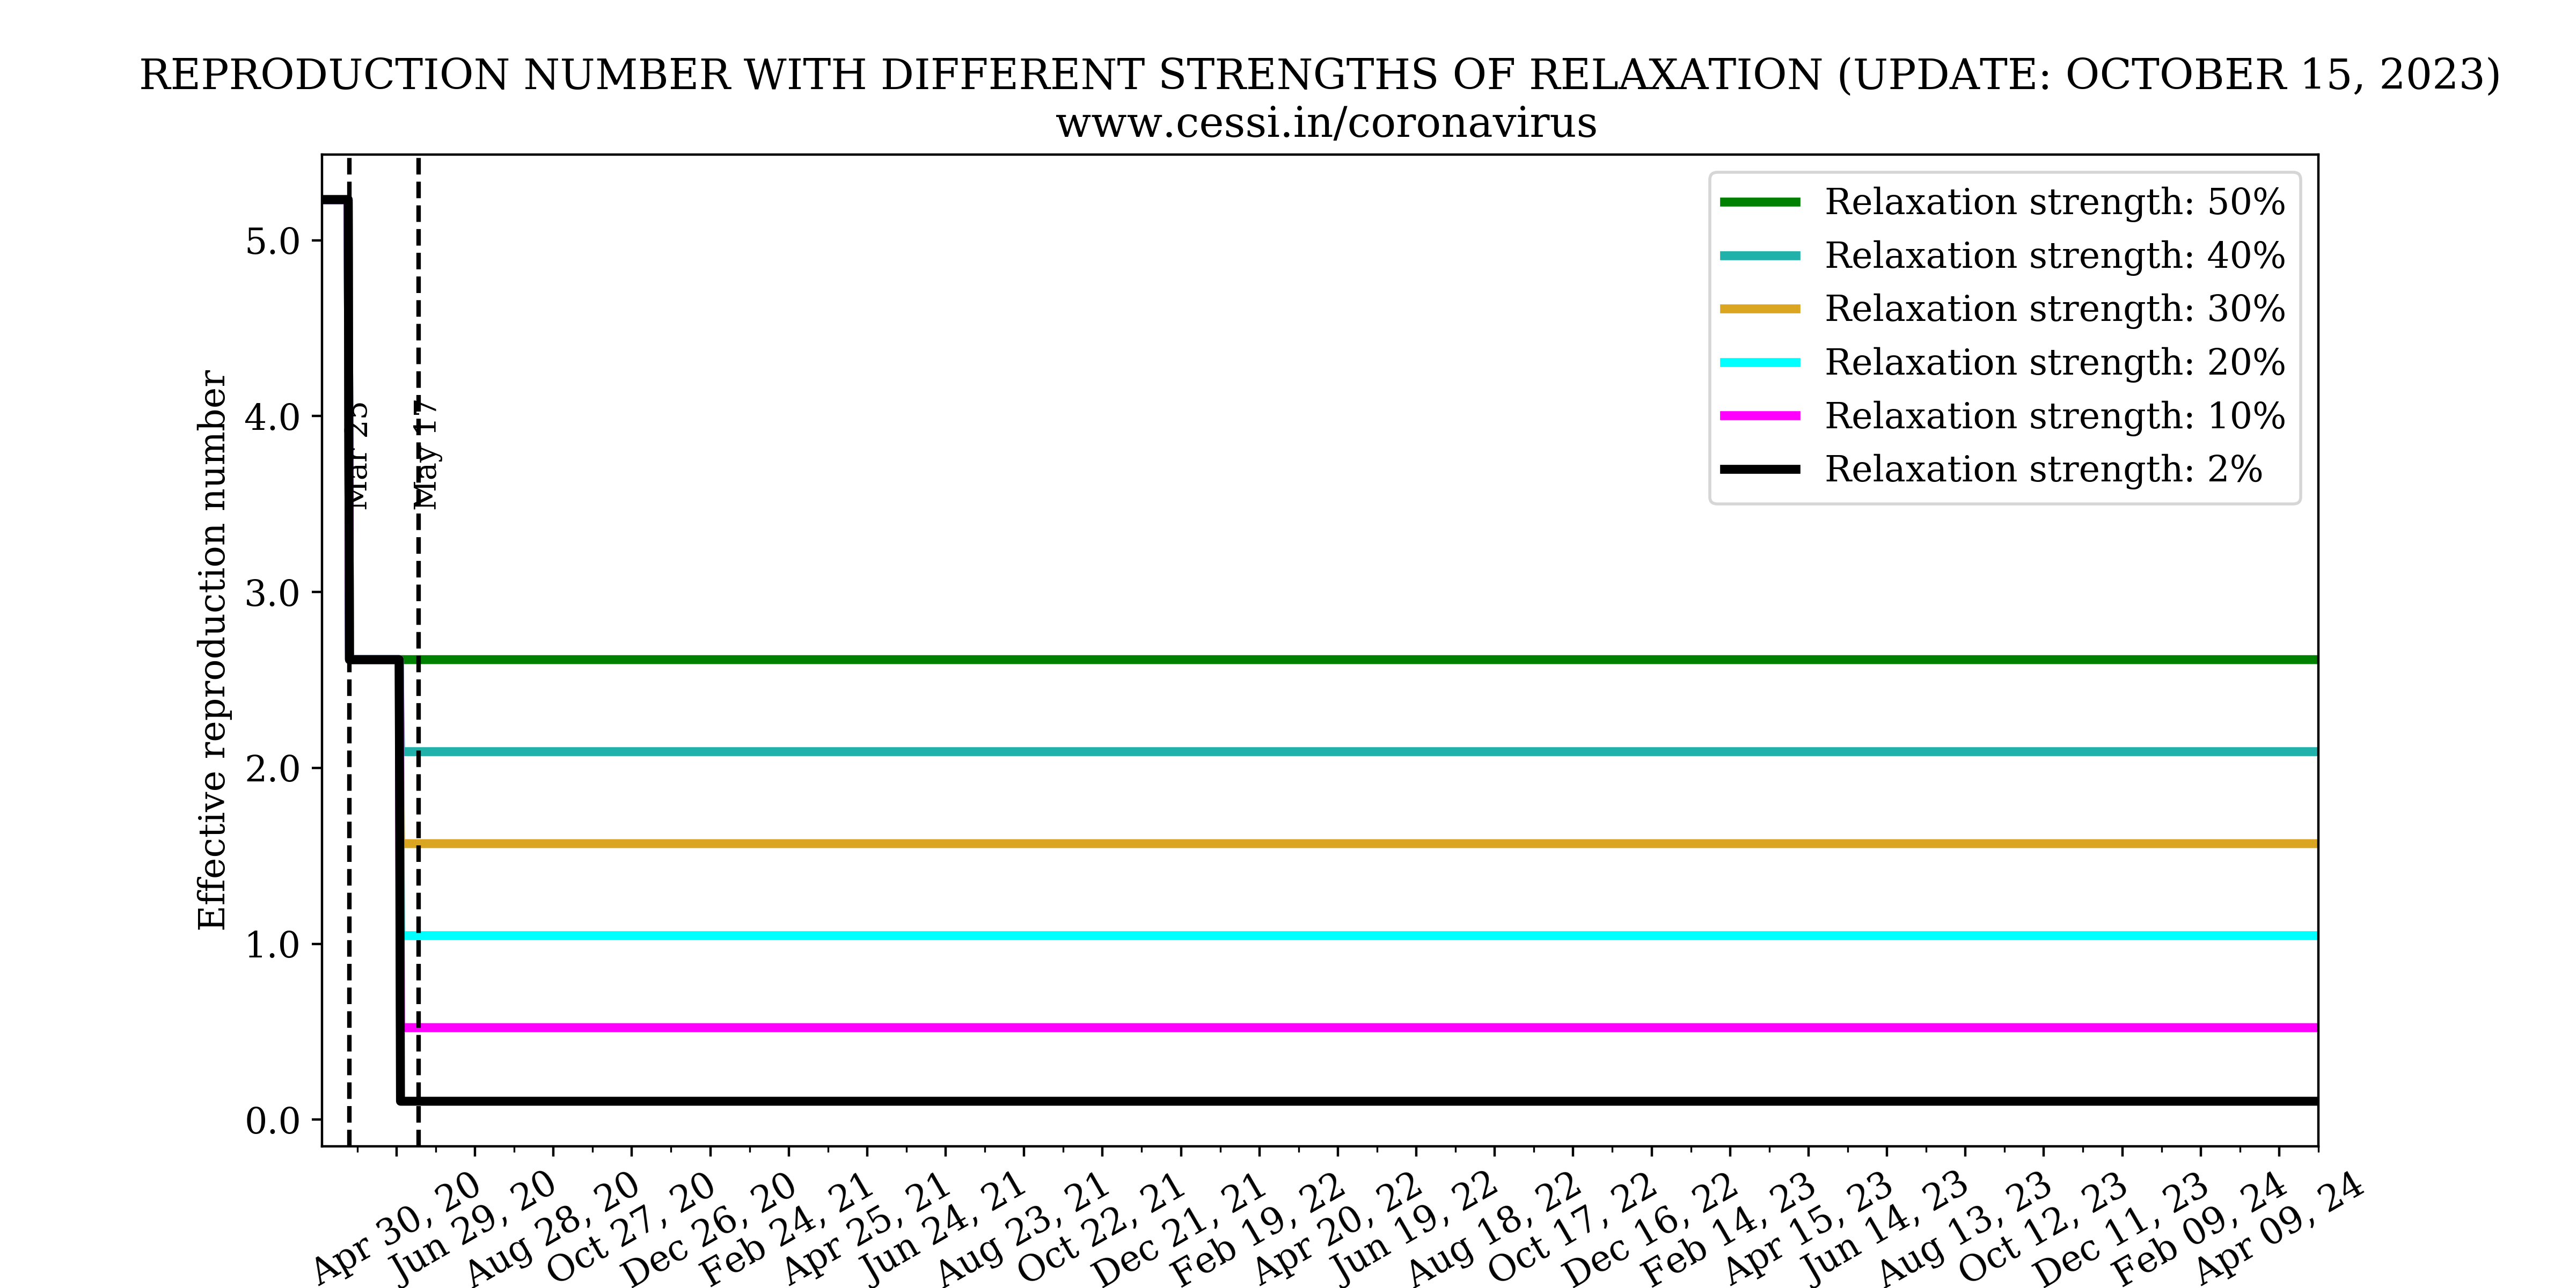
The effective reproduction number variation with time can be inferred from the above plot.
References
- A state-level epidemiological model for India: INDSCI-SIM
- SEIR and SEIRS models
- Richard J. H. et. al., Public health interventions and epidemic intensity during the 1918 influenza pandemic (2007), PNAS, 104 (18), May 2007, Pages 7582-7587
- Flaxman, S. et. al., Estimating the effects of non-pharmaceutical interventions on COVID-19 in Europe (2020), Nature, June 2020
- https://www.who.int/bulletin/online_first/20-255695.pdf
- Simulation & Parameter Estimation of SEIRD Model.
- Baker RE, Peña J-M, Jayamohan J and Jérusalem A., 2018, Mechanistic models versus machine learning, a fight worth fighting for the biological community? Biol. Lett., 1420170660
- Chowell G., Fitting dynamic models to epidemic outbreaks with quantified uncertainty: A primer for parameter uncertainty, identifiability, and forecasts (2017), Infectious Disease Modelling Volume 2, Issue 3, August 2017, Pages 379–398