COVID19 PROGRESSION IN PUNE AND MAHARASTRA
Pune is one of the highly populated cities of Maharastra -- an Indian state which is the most affected by COVID19. Here are some of the crucial plots which might be helpful in assessing the current scenario of COVI19 progression in Maharastra and Pune. It is important to note that the dataset used for the analysis of the state-wide (Maharastra) and city-wide (Pune) progression of COVID19 are obtained from two different sources. The database used for generating the plots can be downloaded here. The line breaks in the plots indicate data gap.
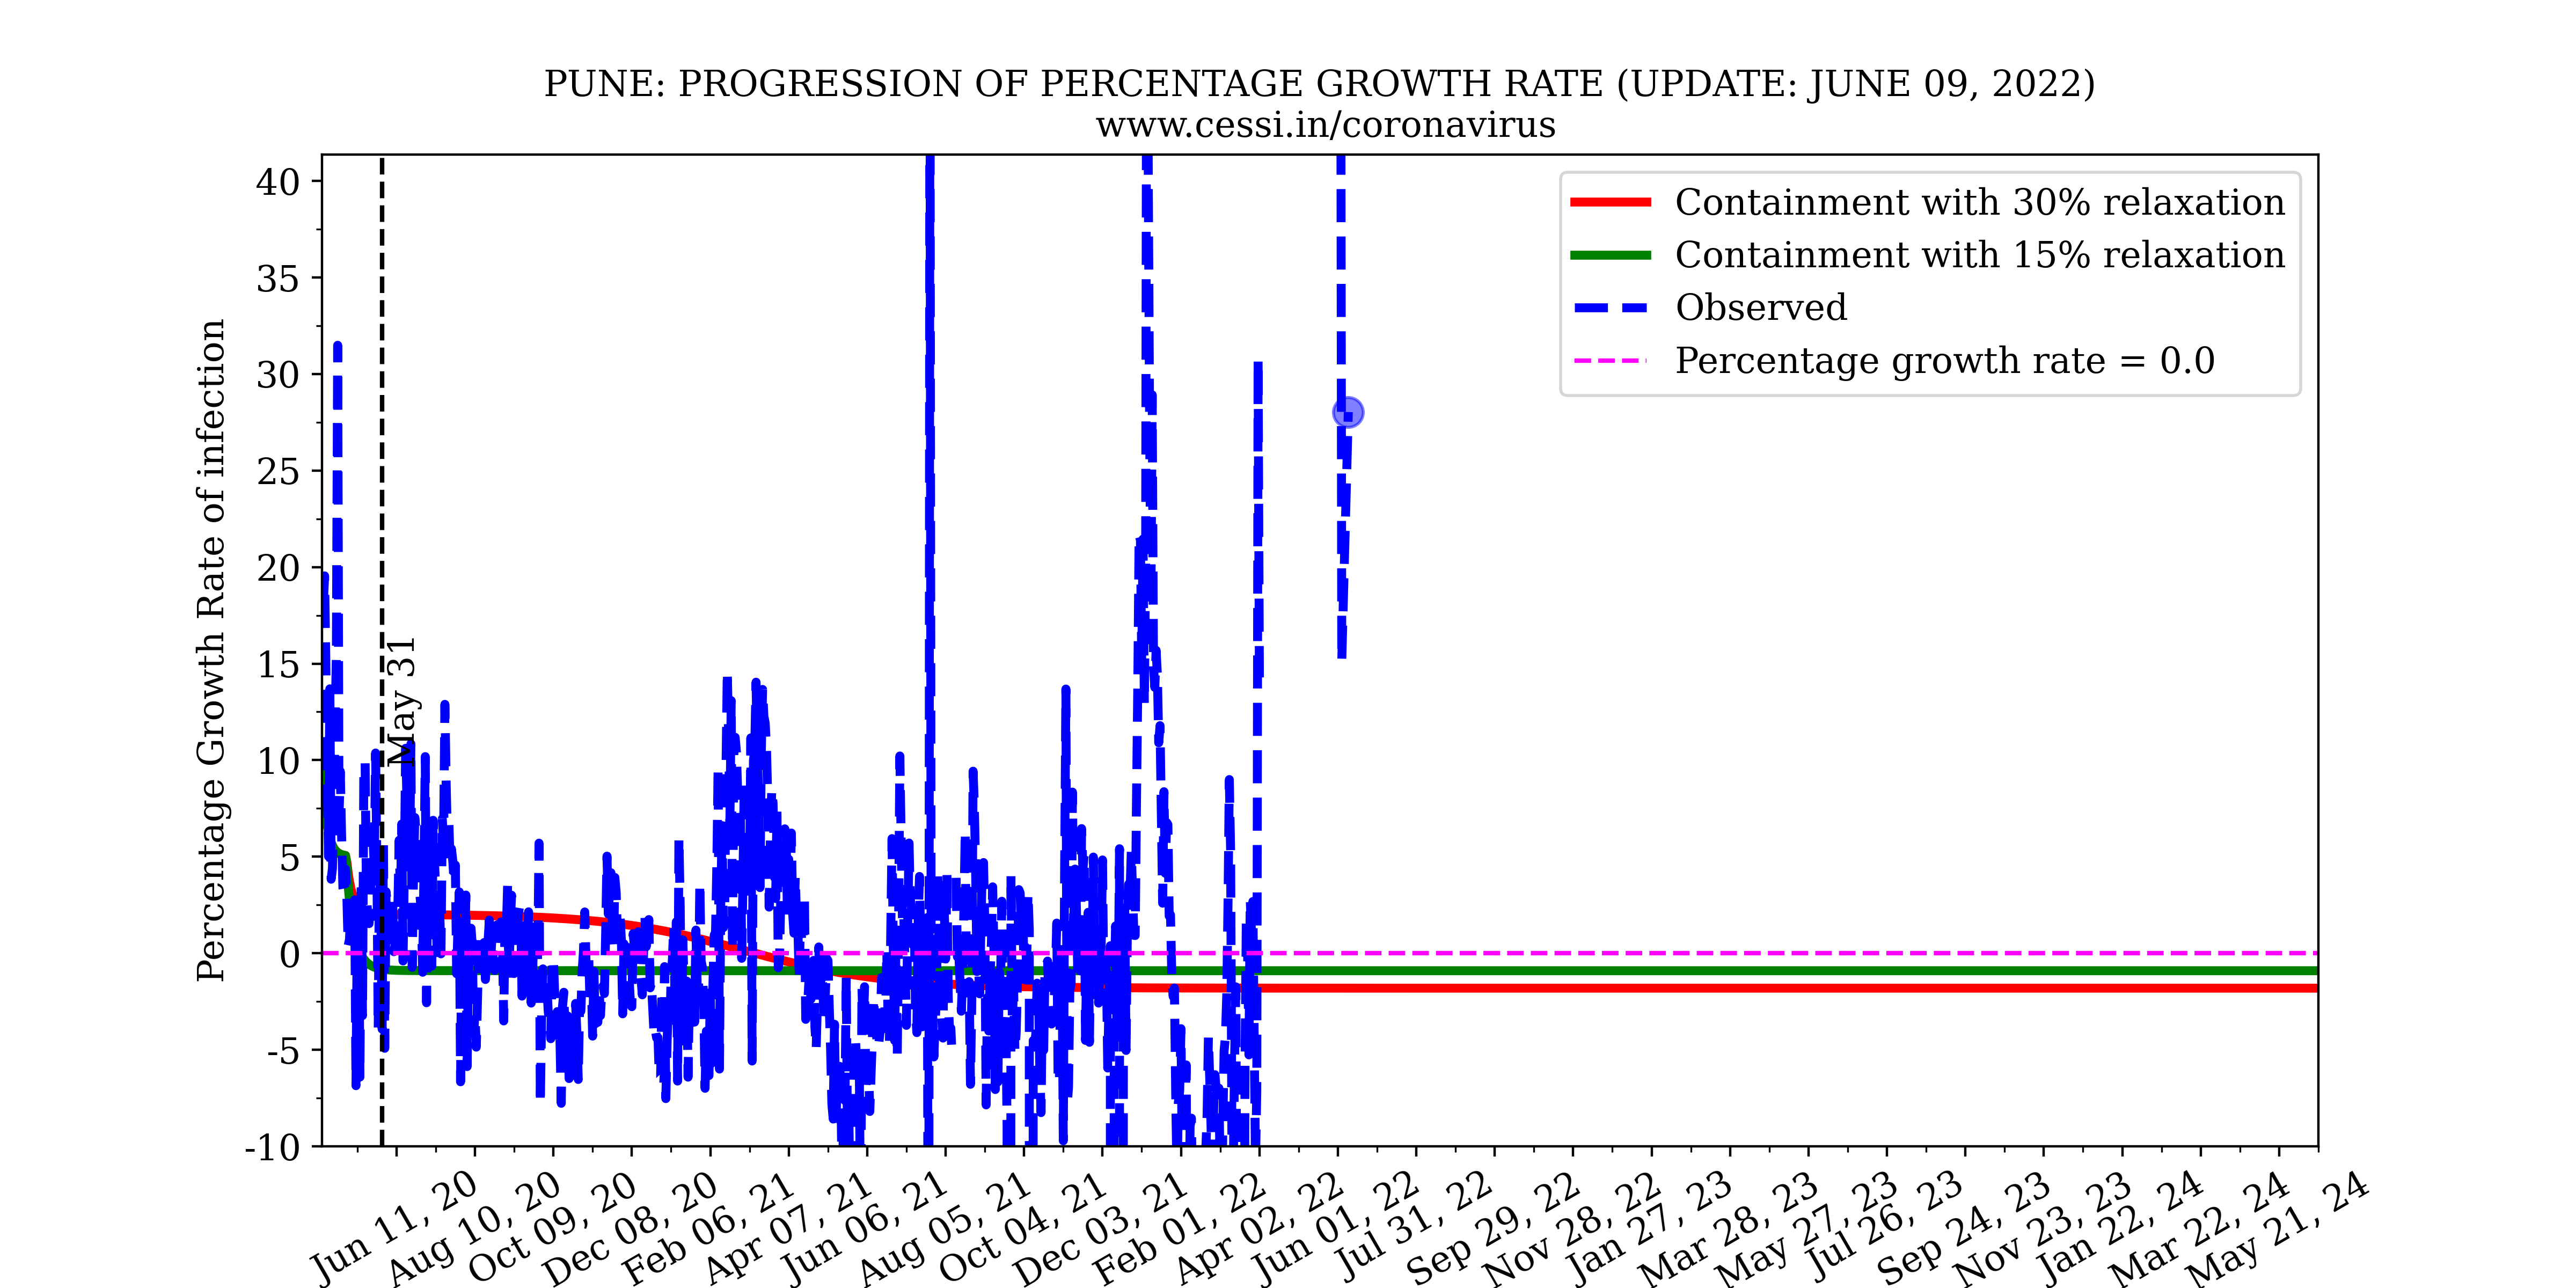
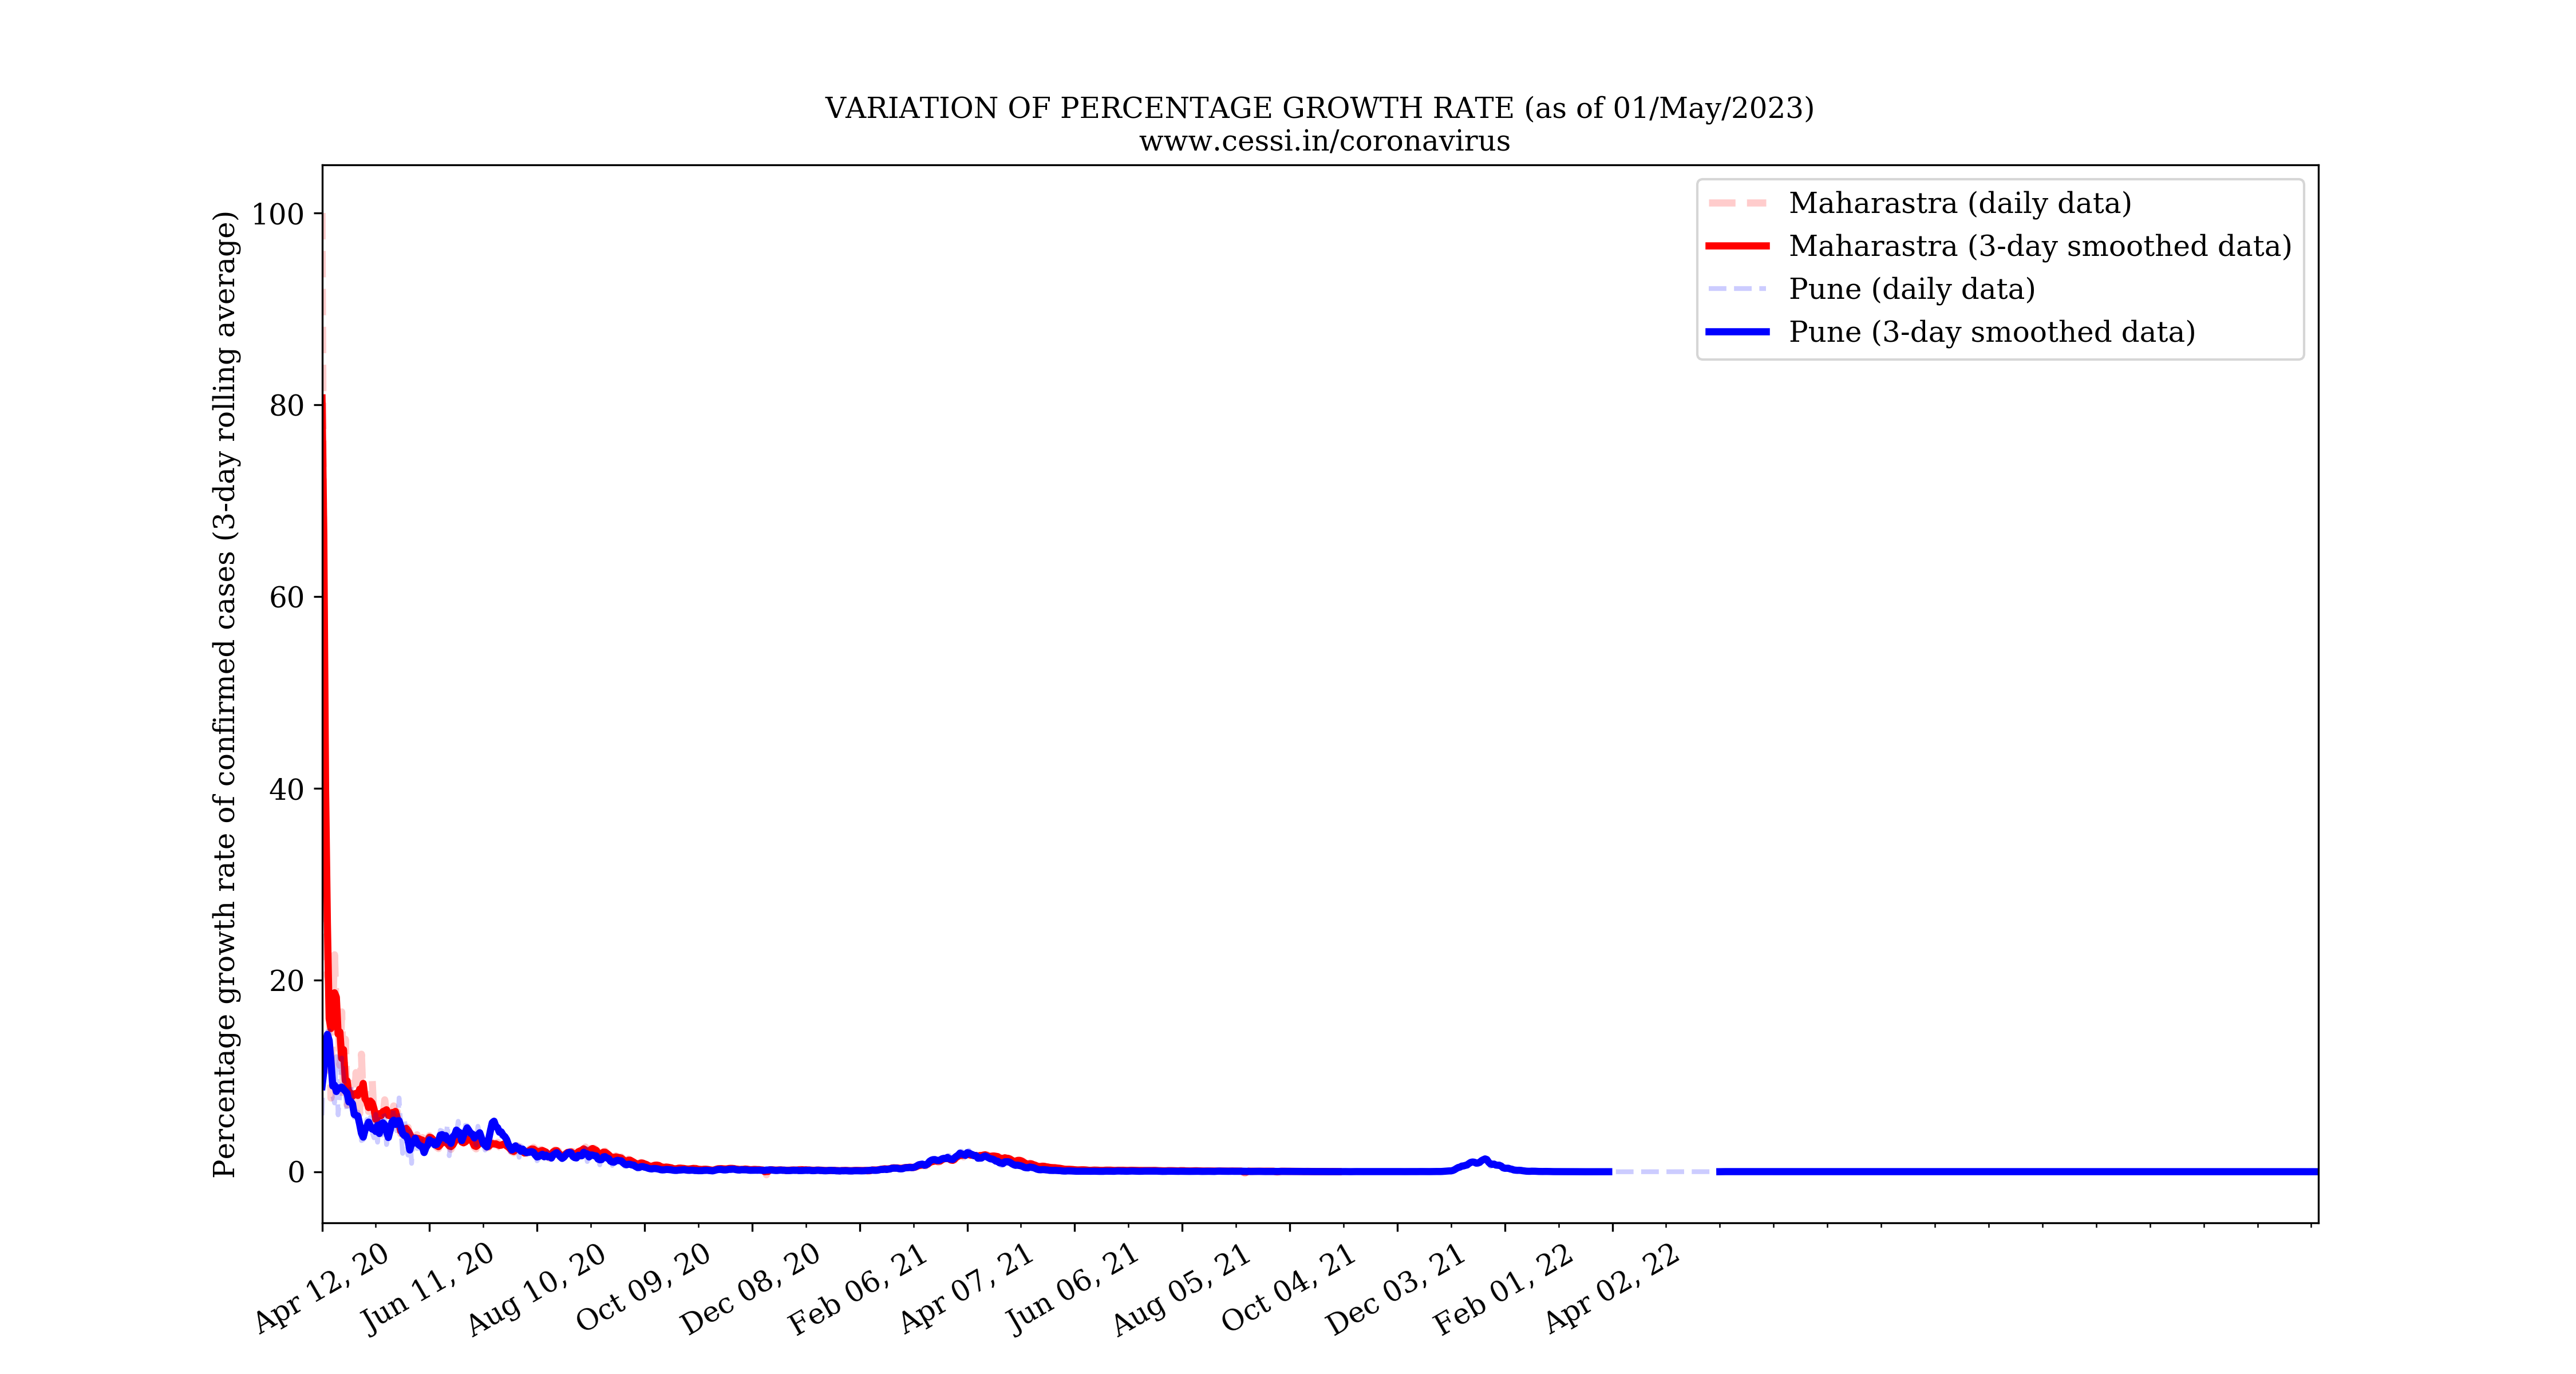
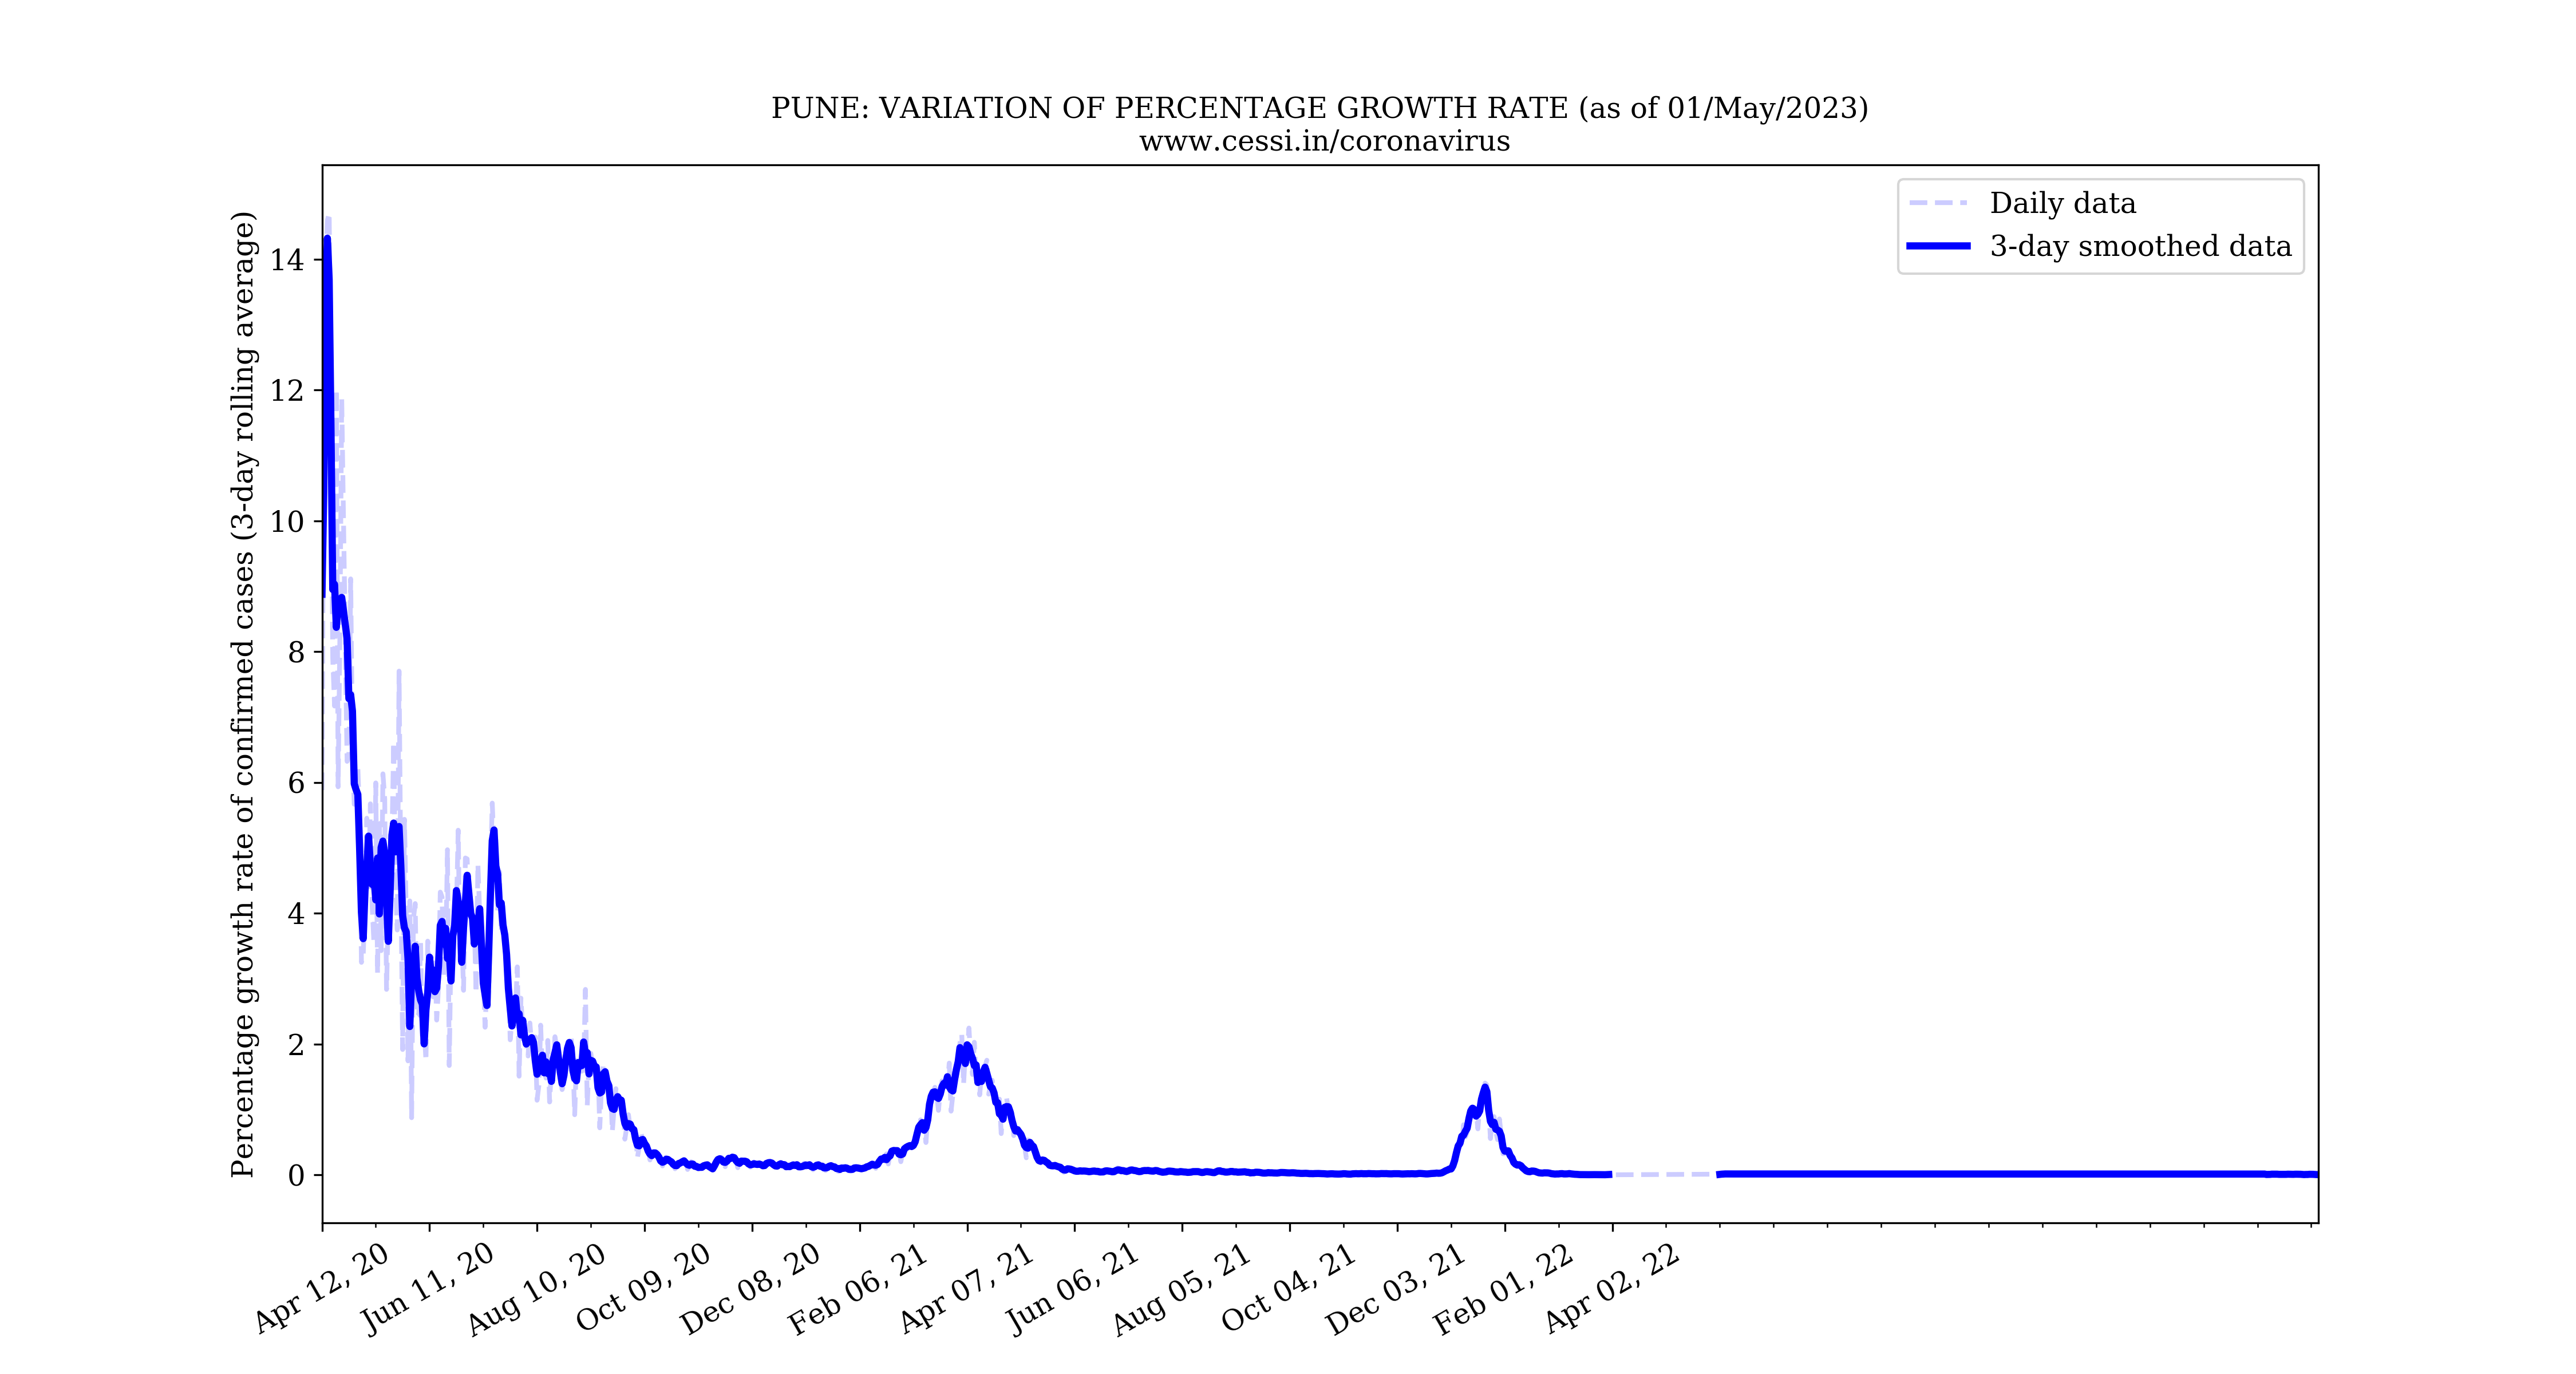
Trend in cases: percentage growth rate (3-day rolling average)
How the growth rate is calculated: 100*daily confirmed cases/total confirmed cases.
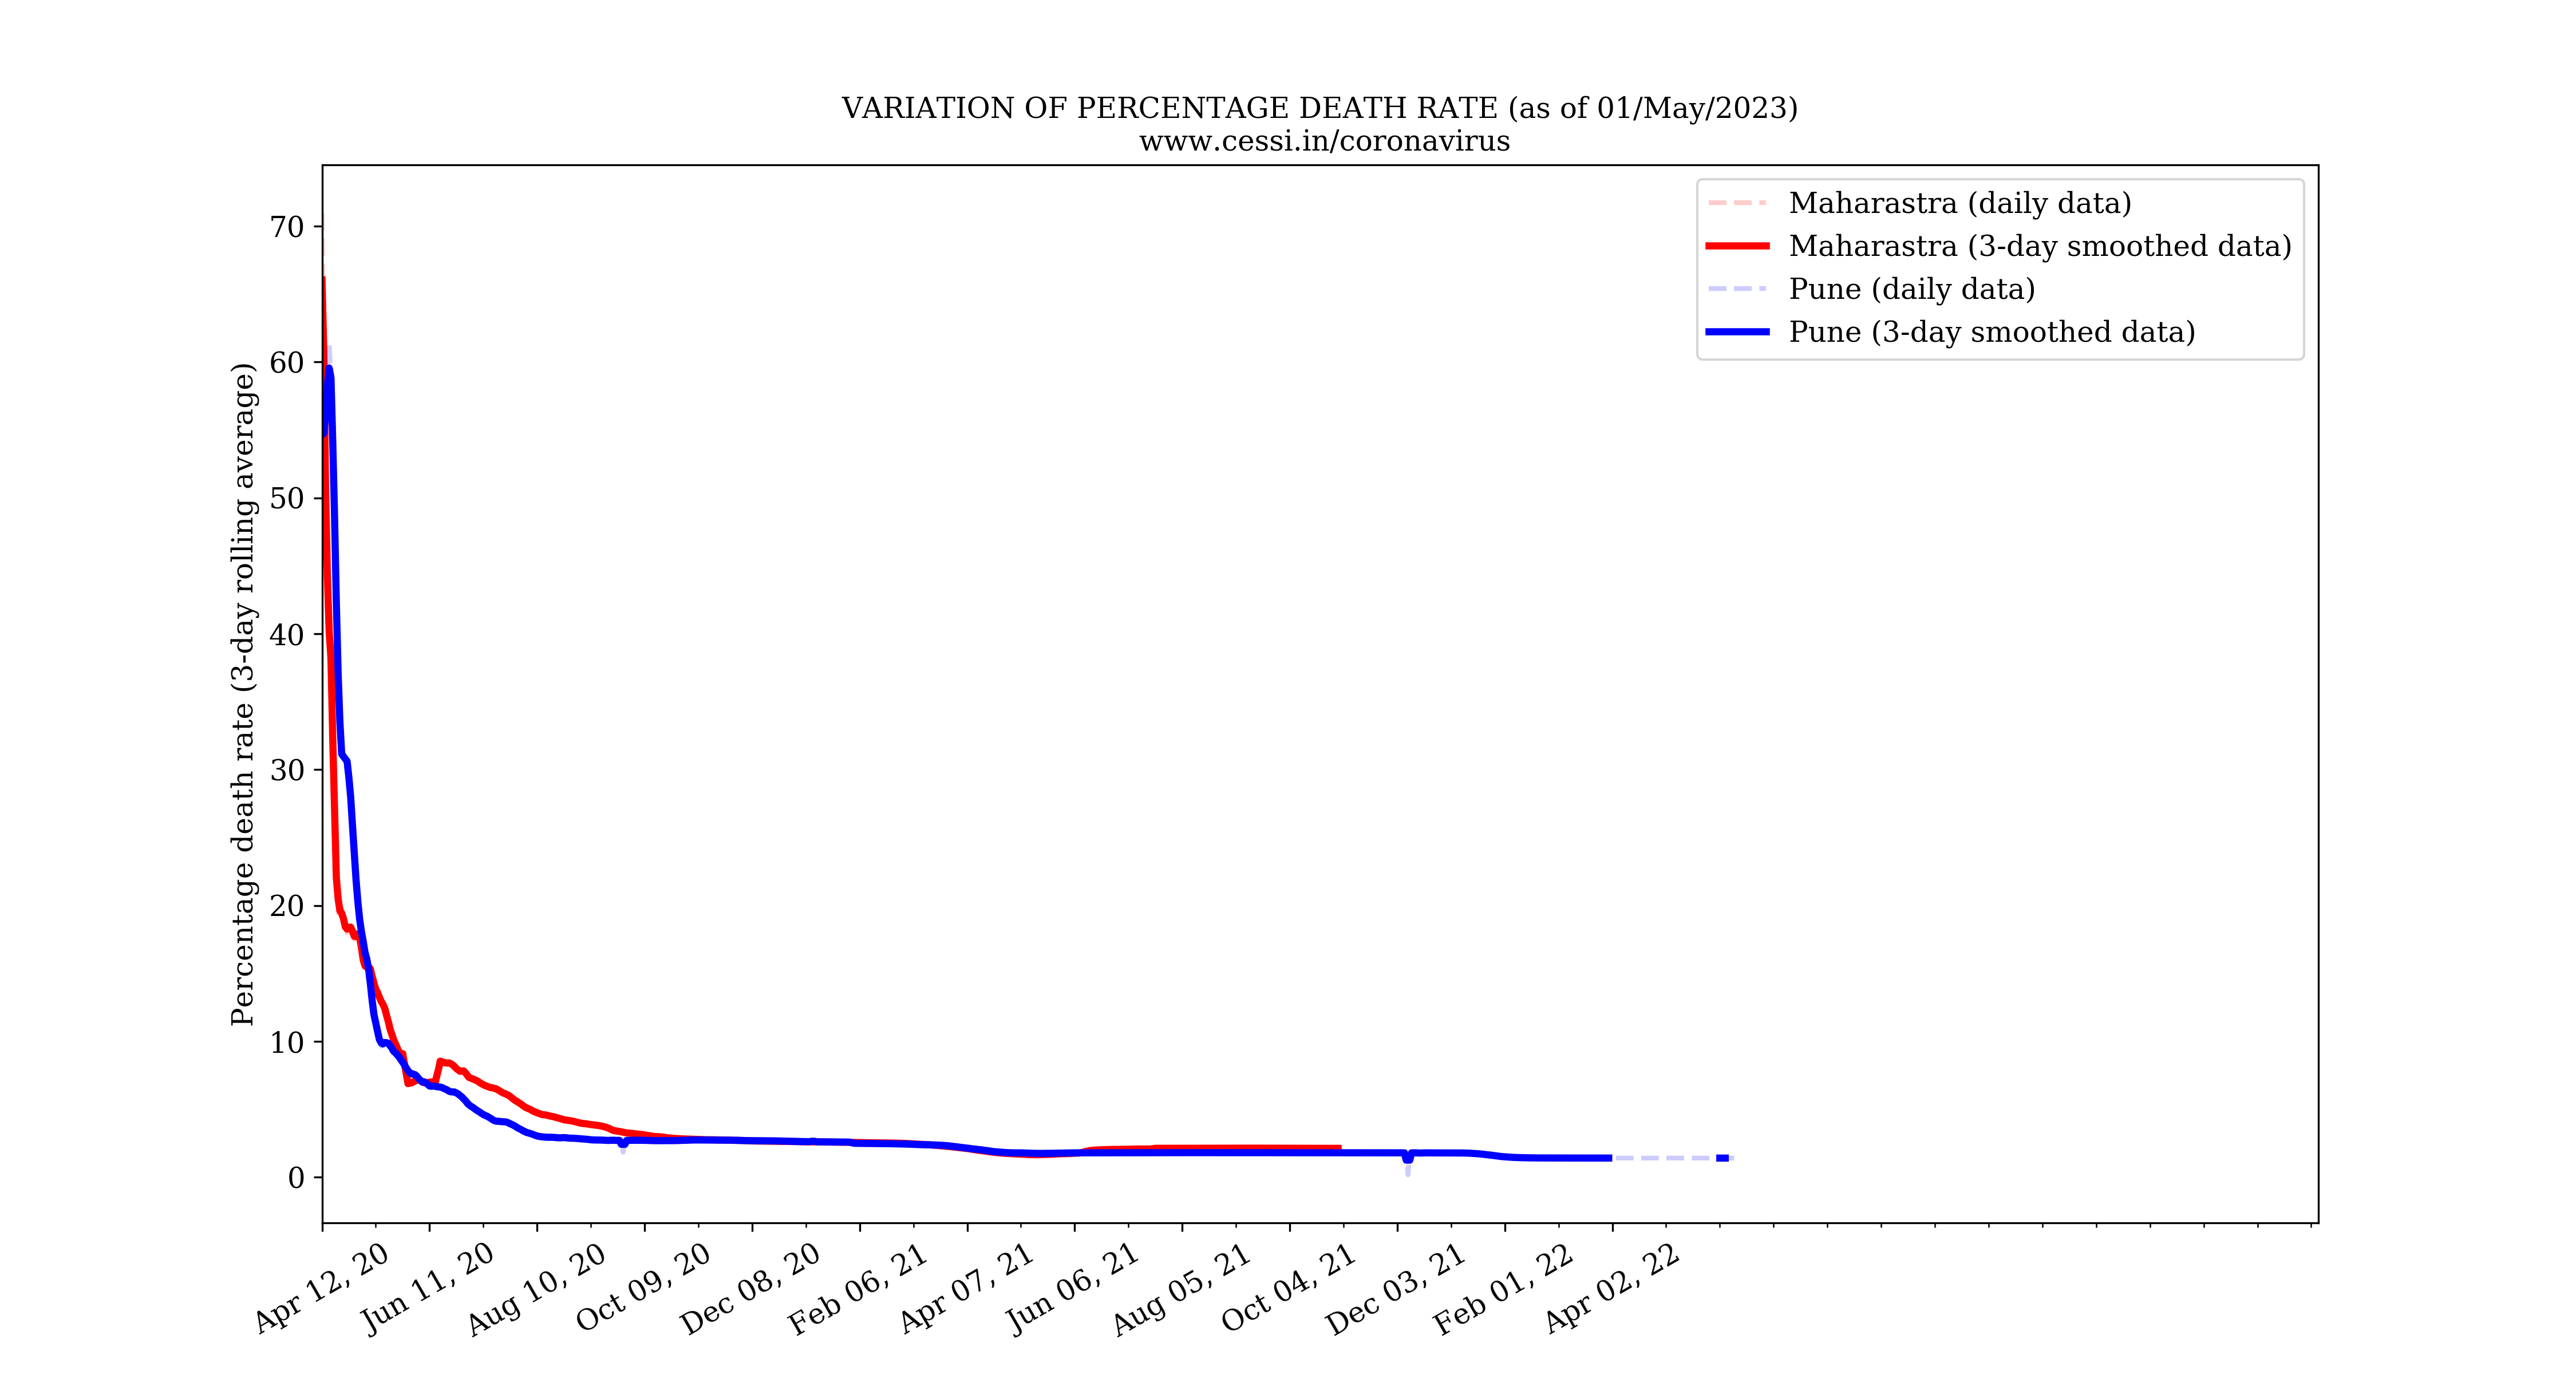
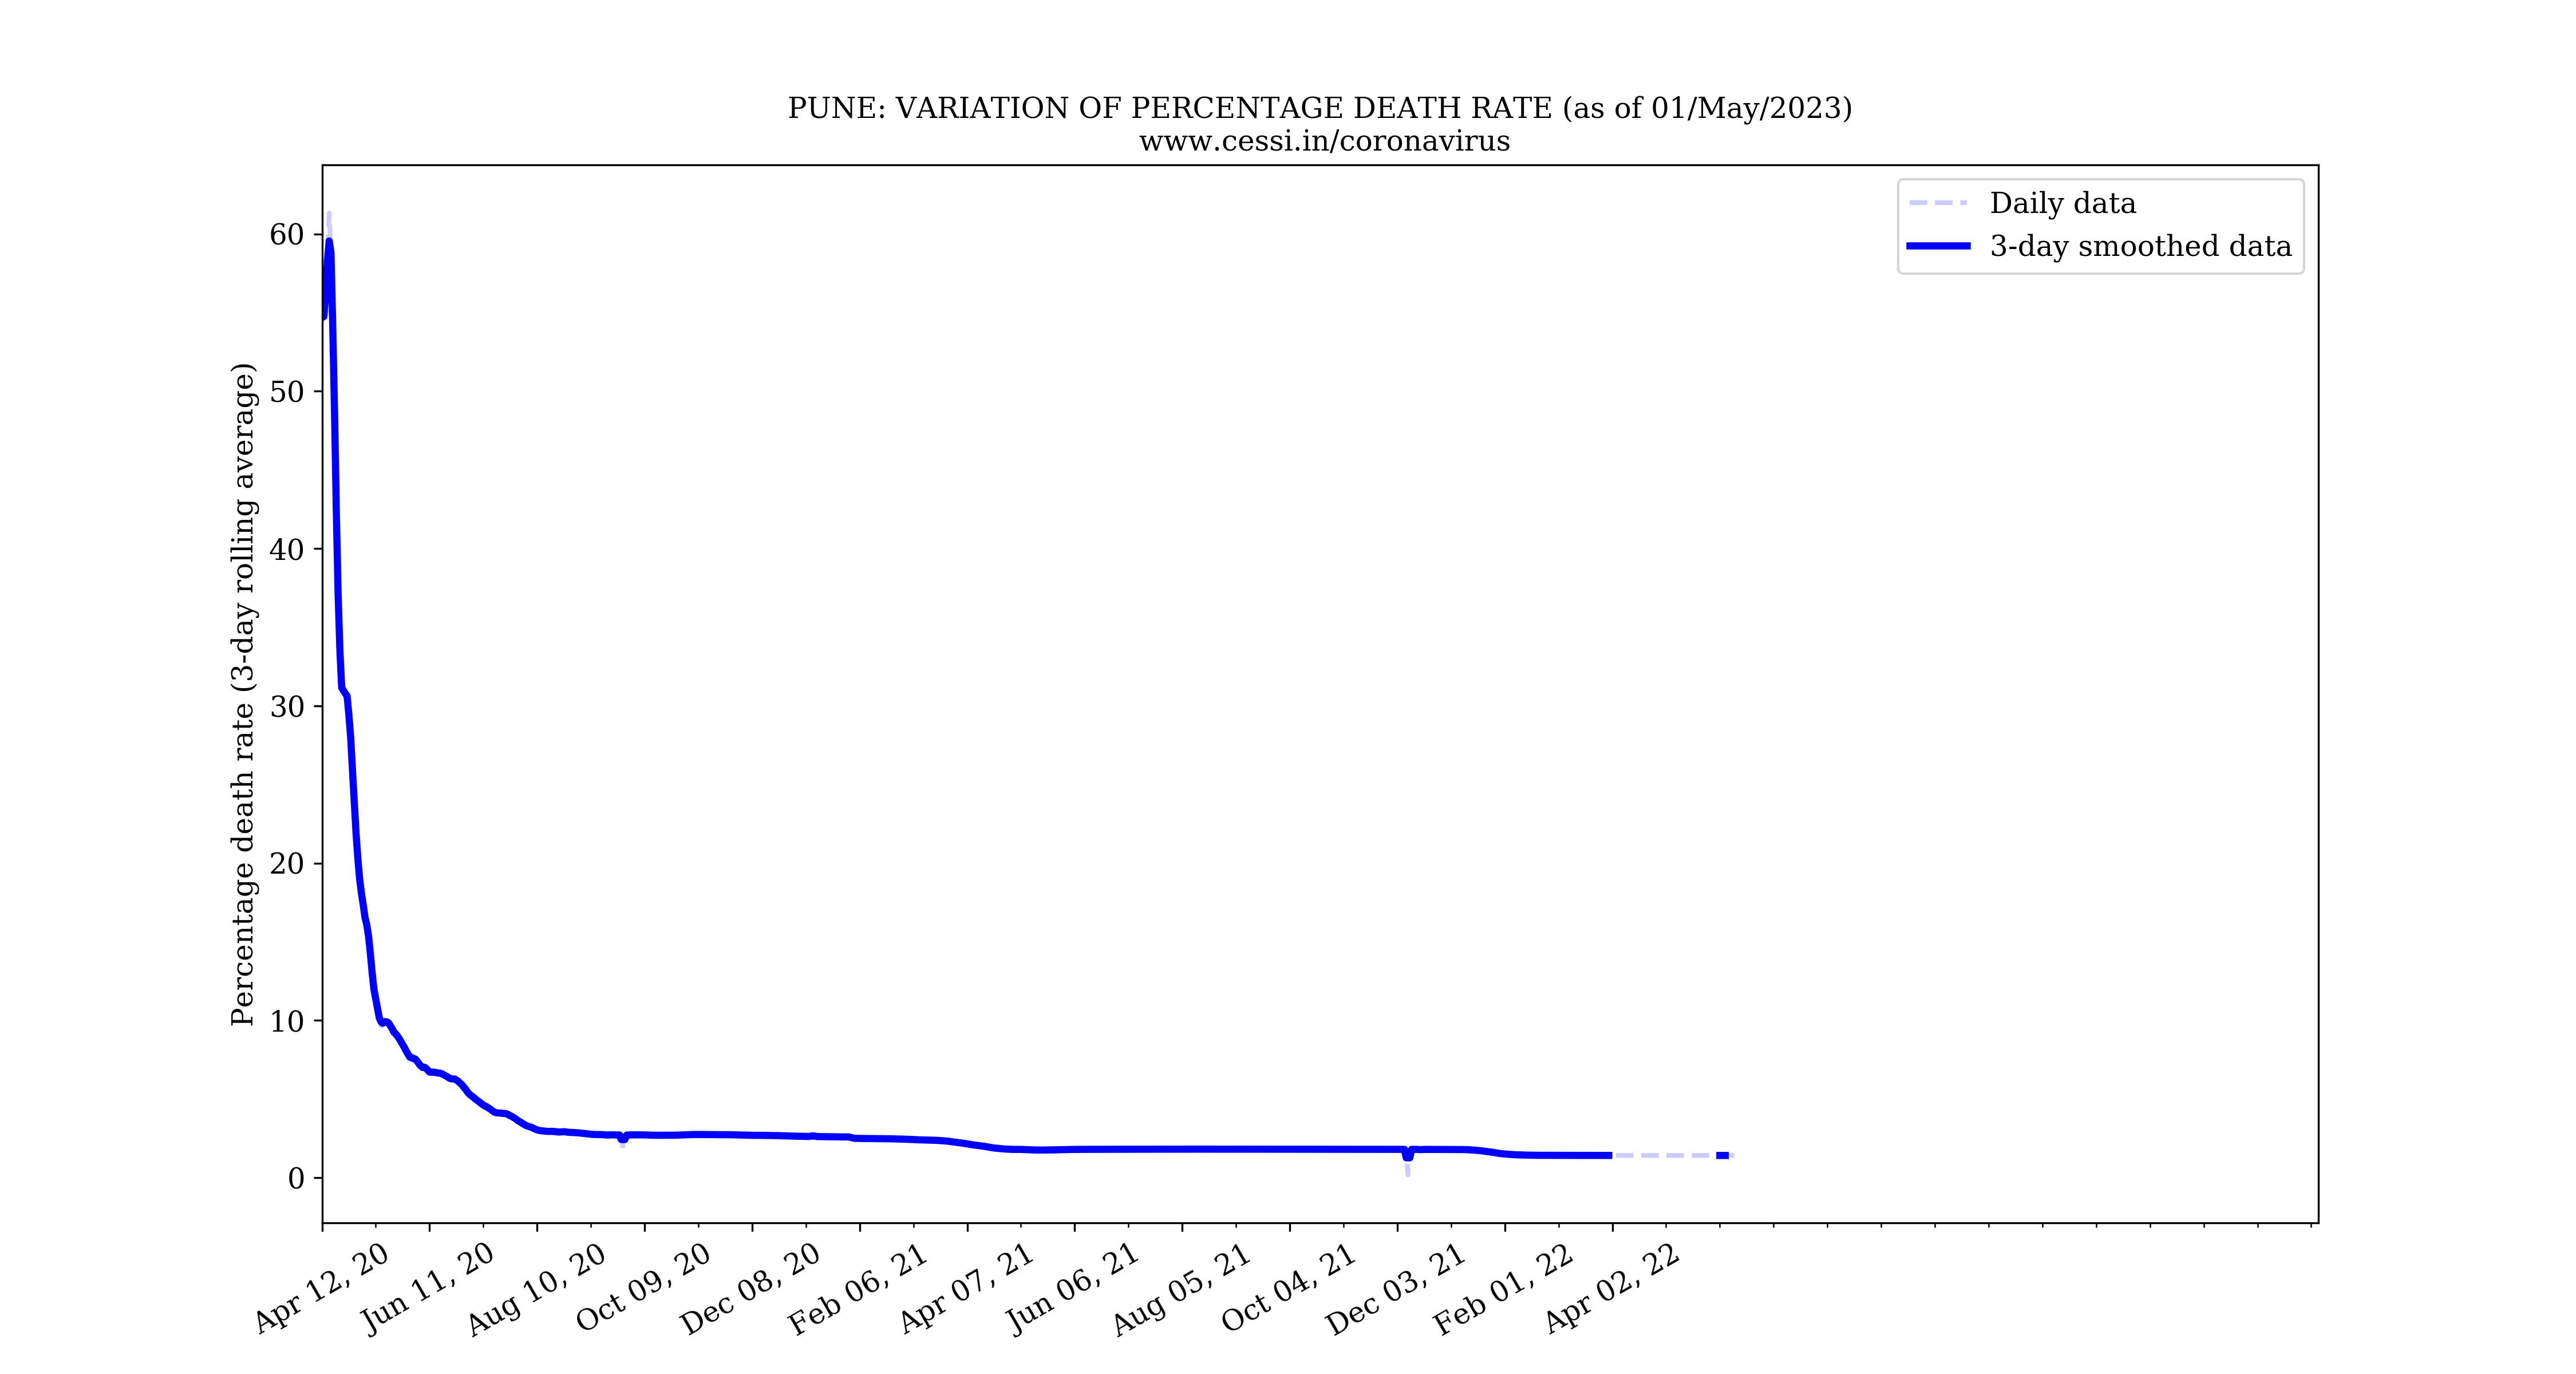
Trend in deaths: percentage death rate (3-day rolling average)
How the death rate is calculated: 100*total deceased/(total deceased + total recovered).
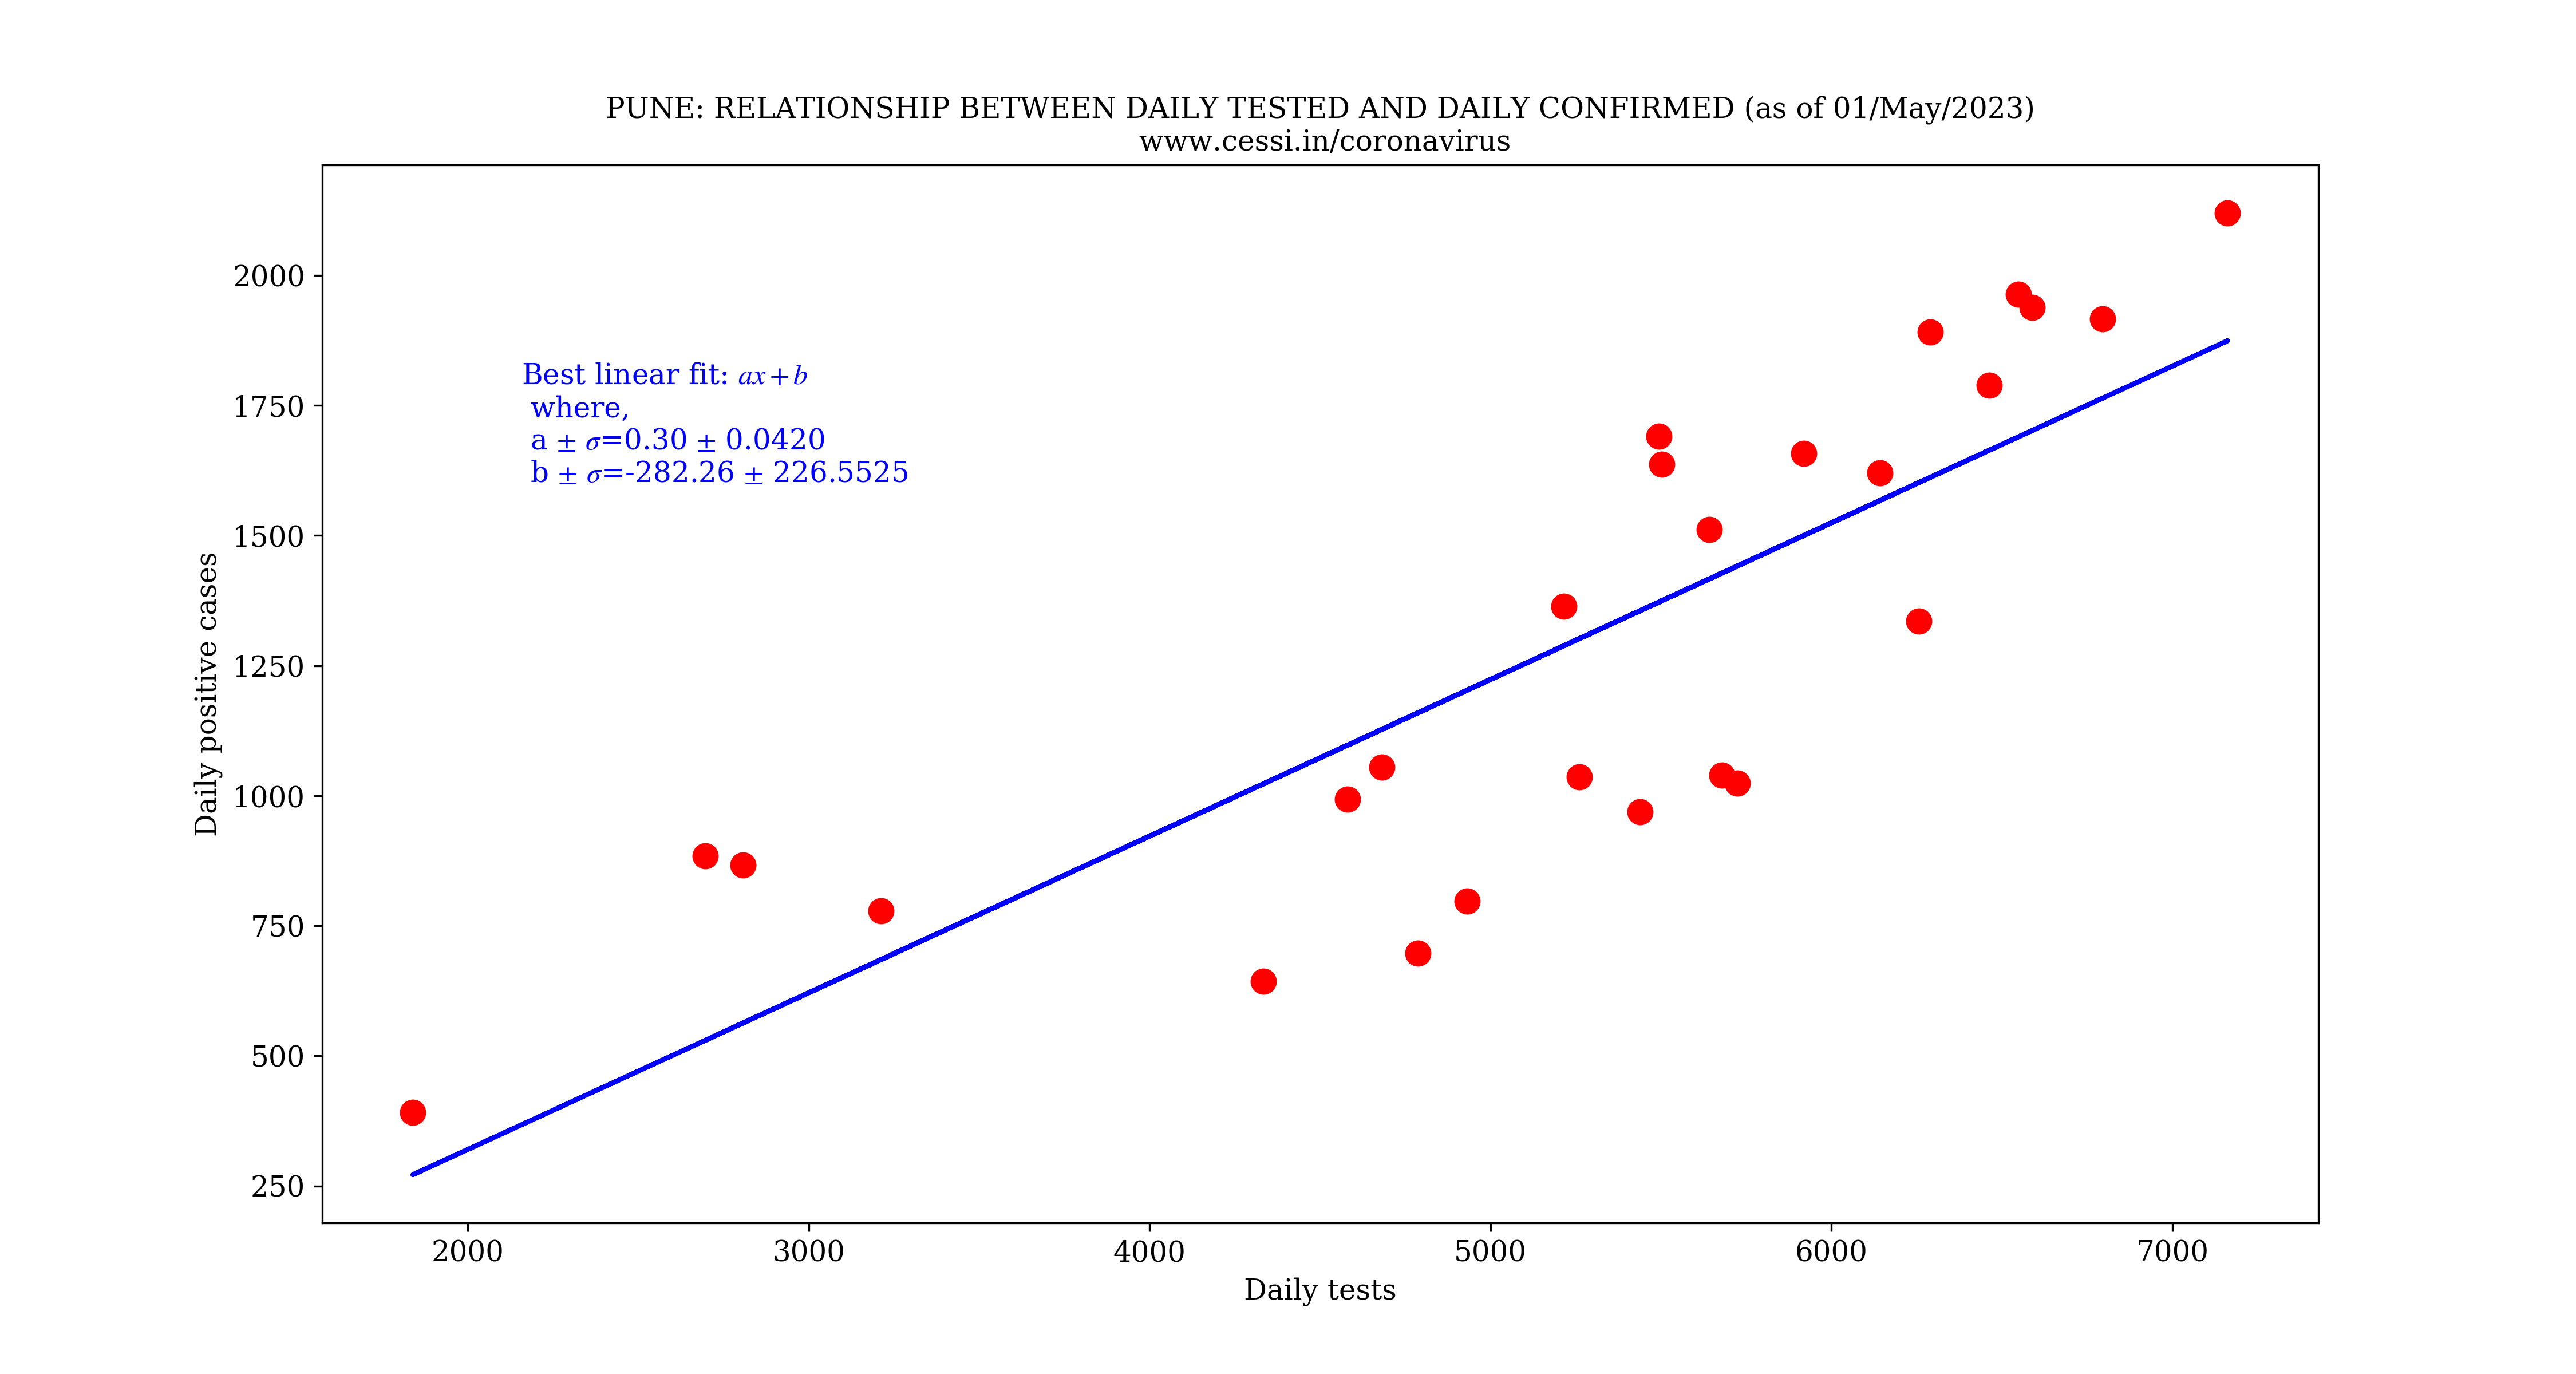
Relationship between daily positive cases and daily tests for Pune
The curve below shows the relationship between daily positive cases and daily number of tests.
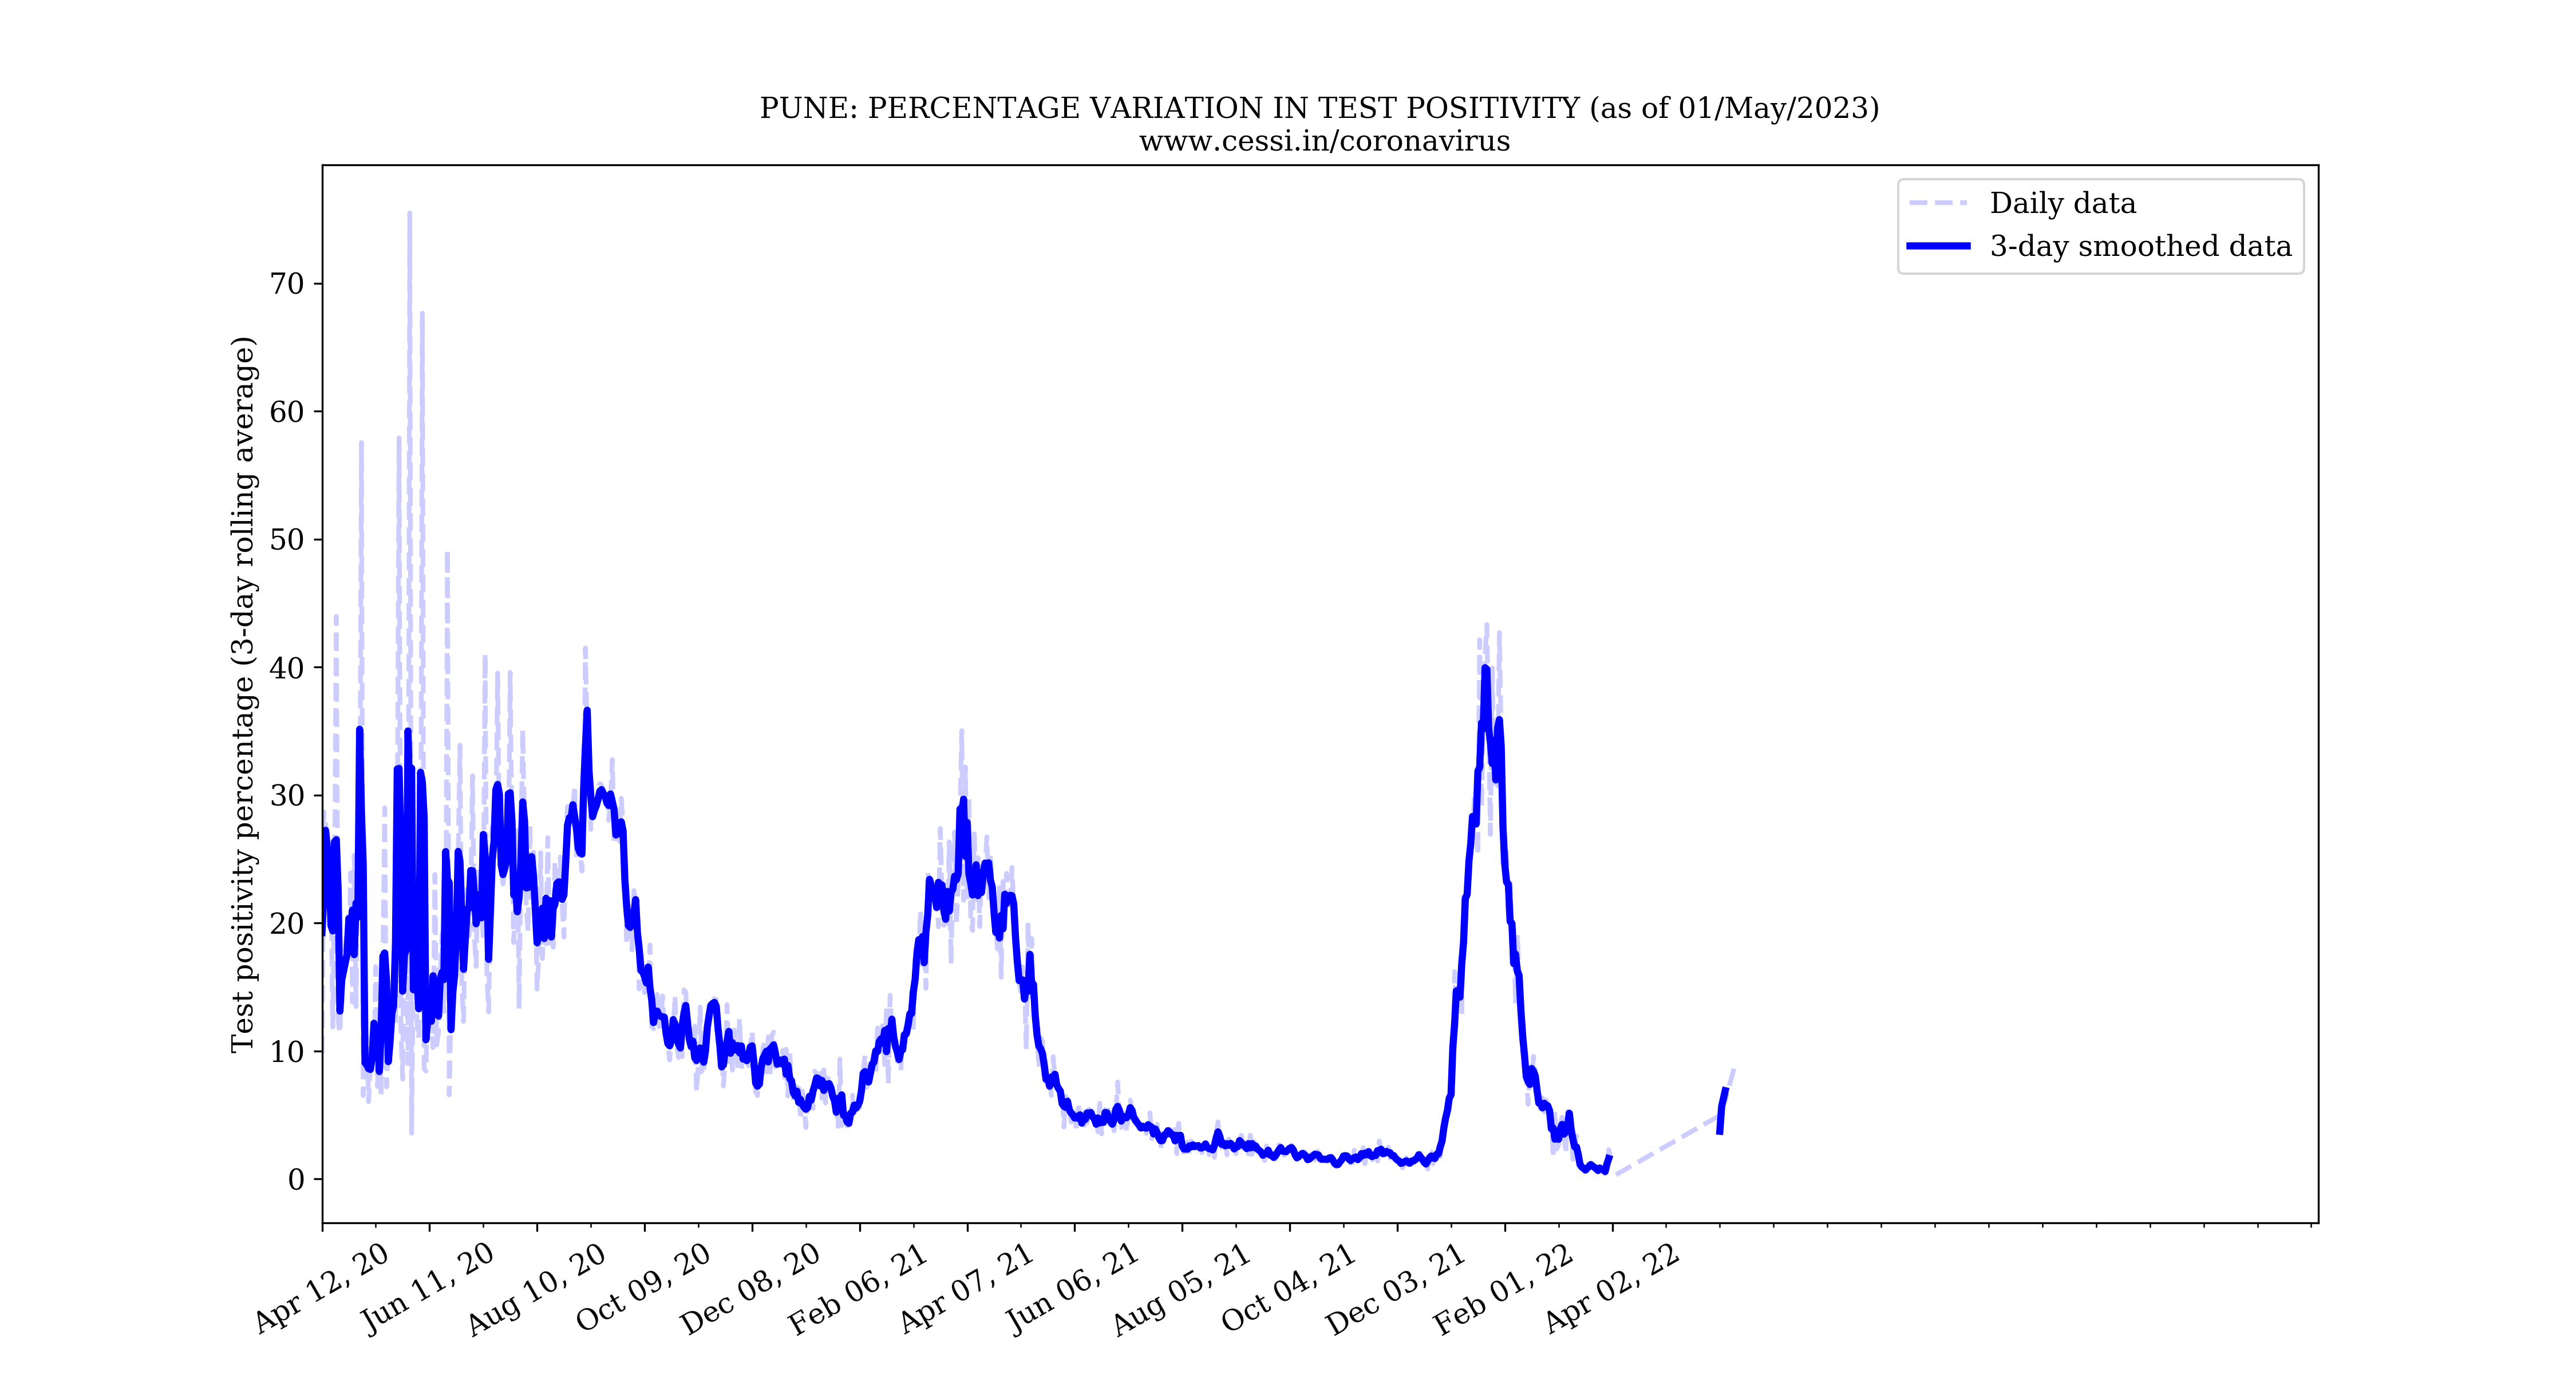
Progression of test positivity percentage for Pune
How the test positivity percentage is calculated: 100*daily confirmed/daily tested.
The assumption in this plot is that the results become immediately available on a daily basis following tests,
which may not be true.
However, the long term trends would not be affected by the validity of this assumption.
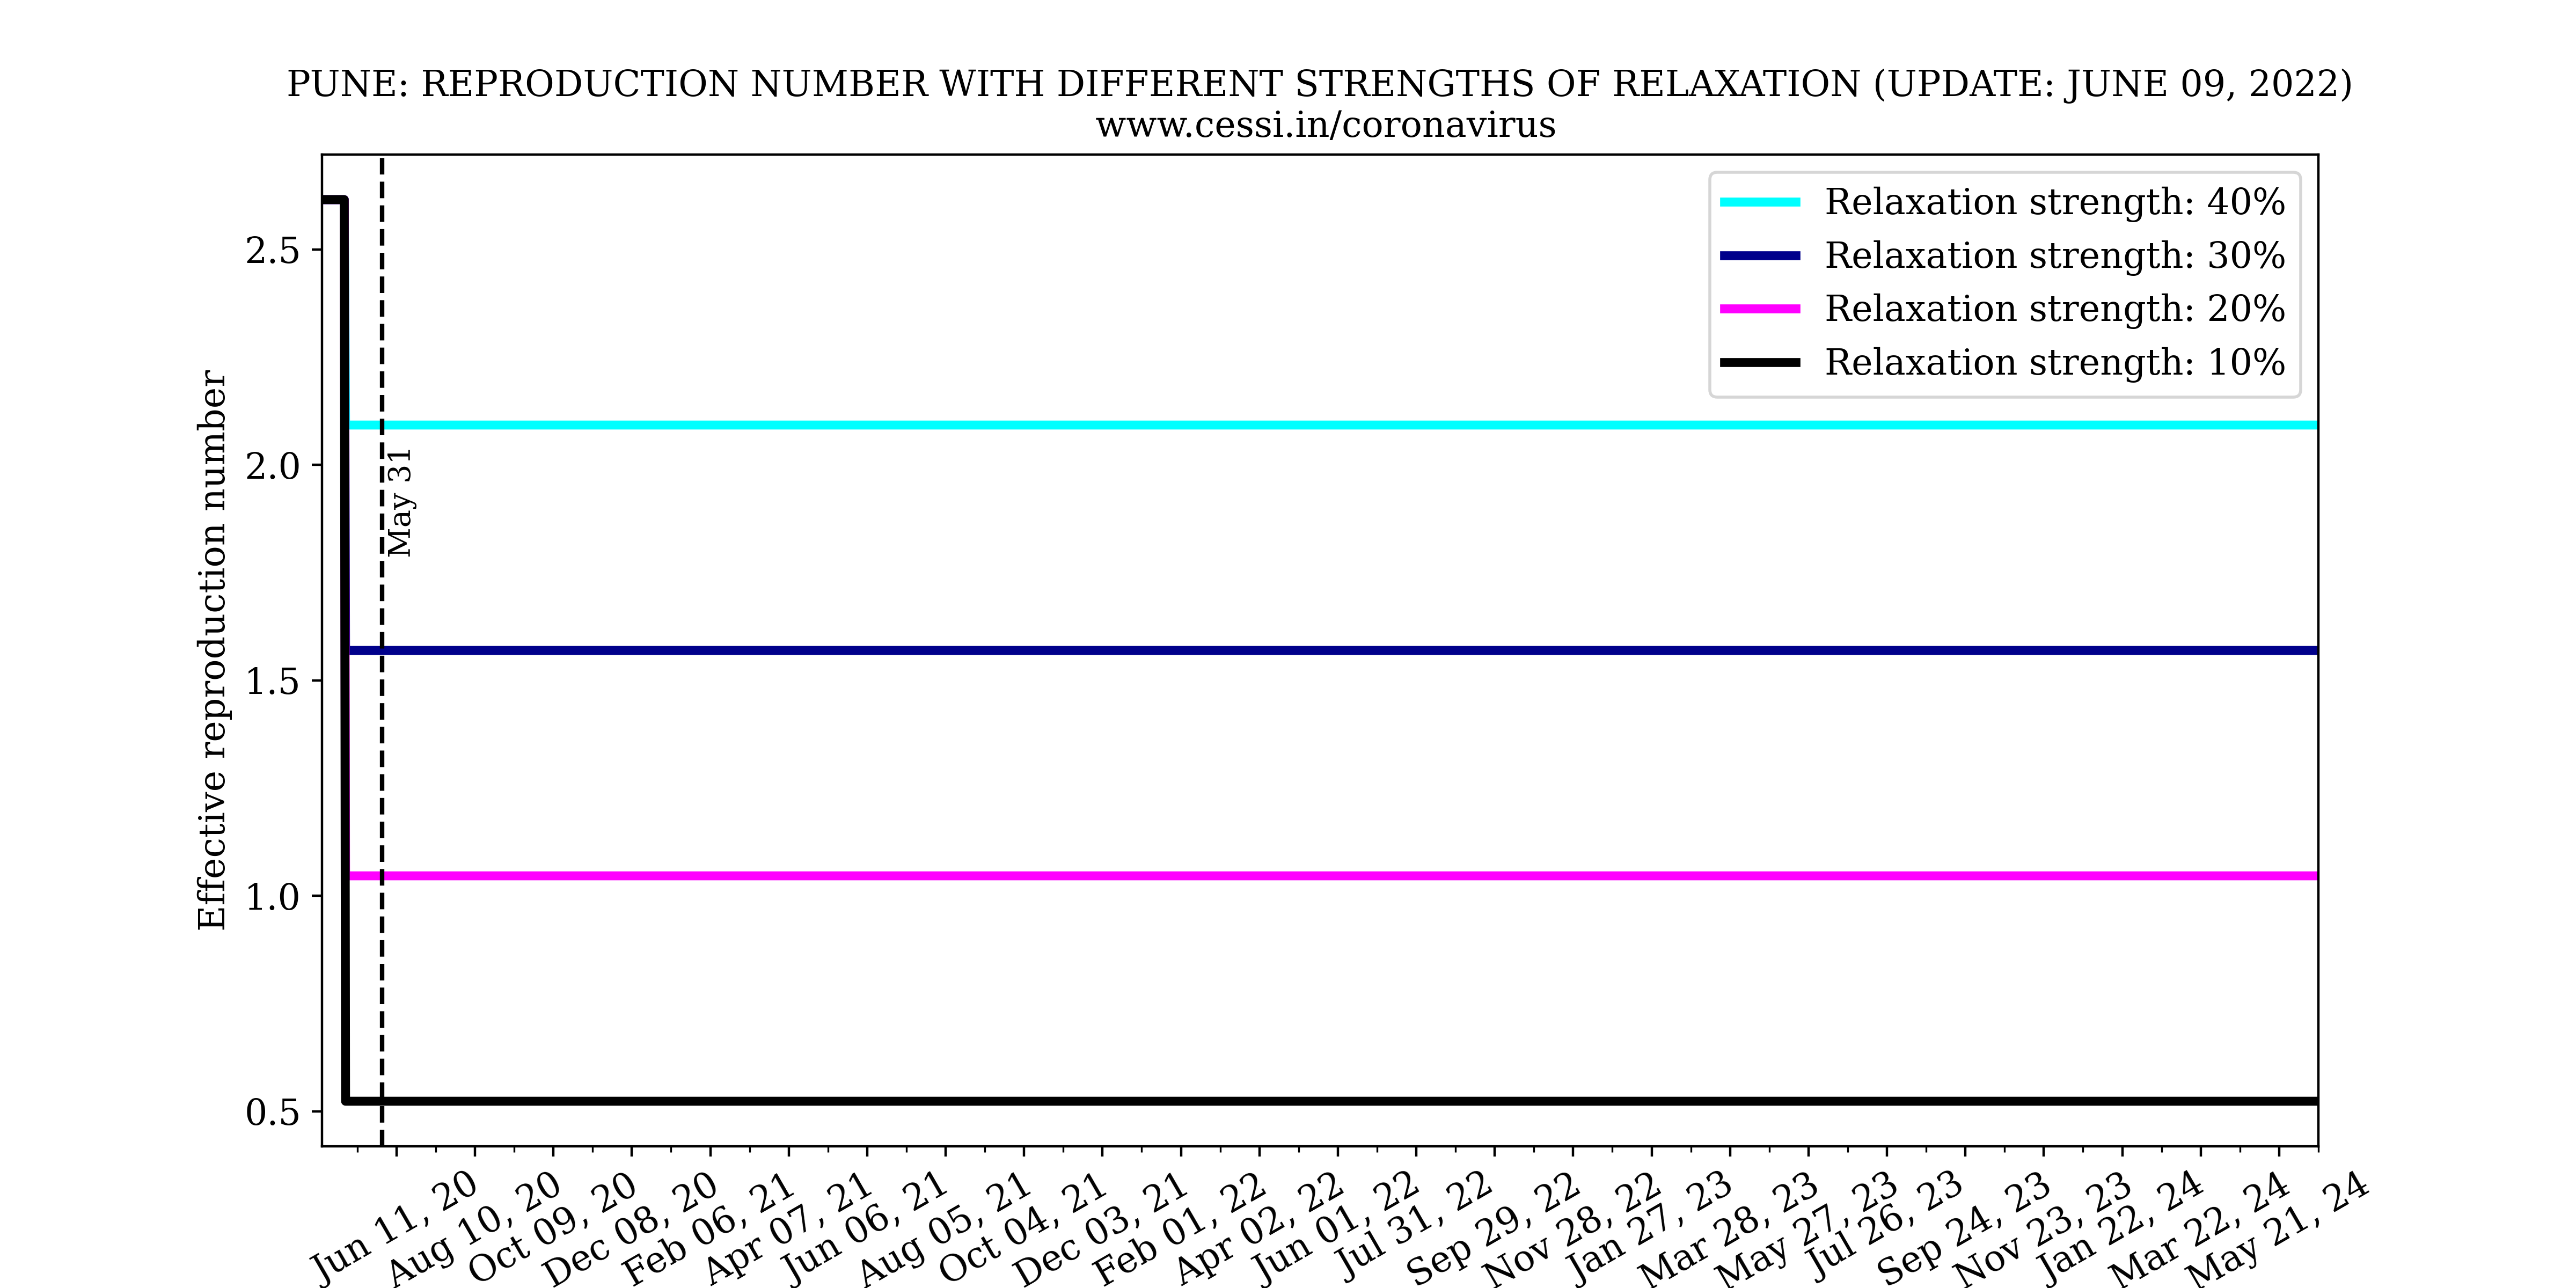
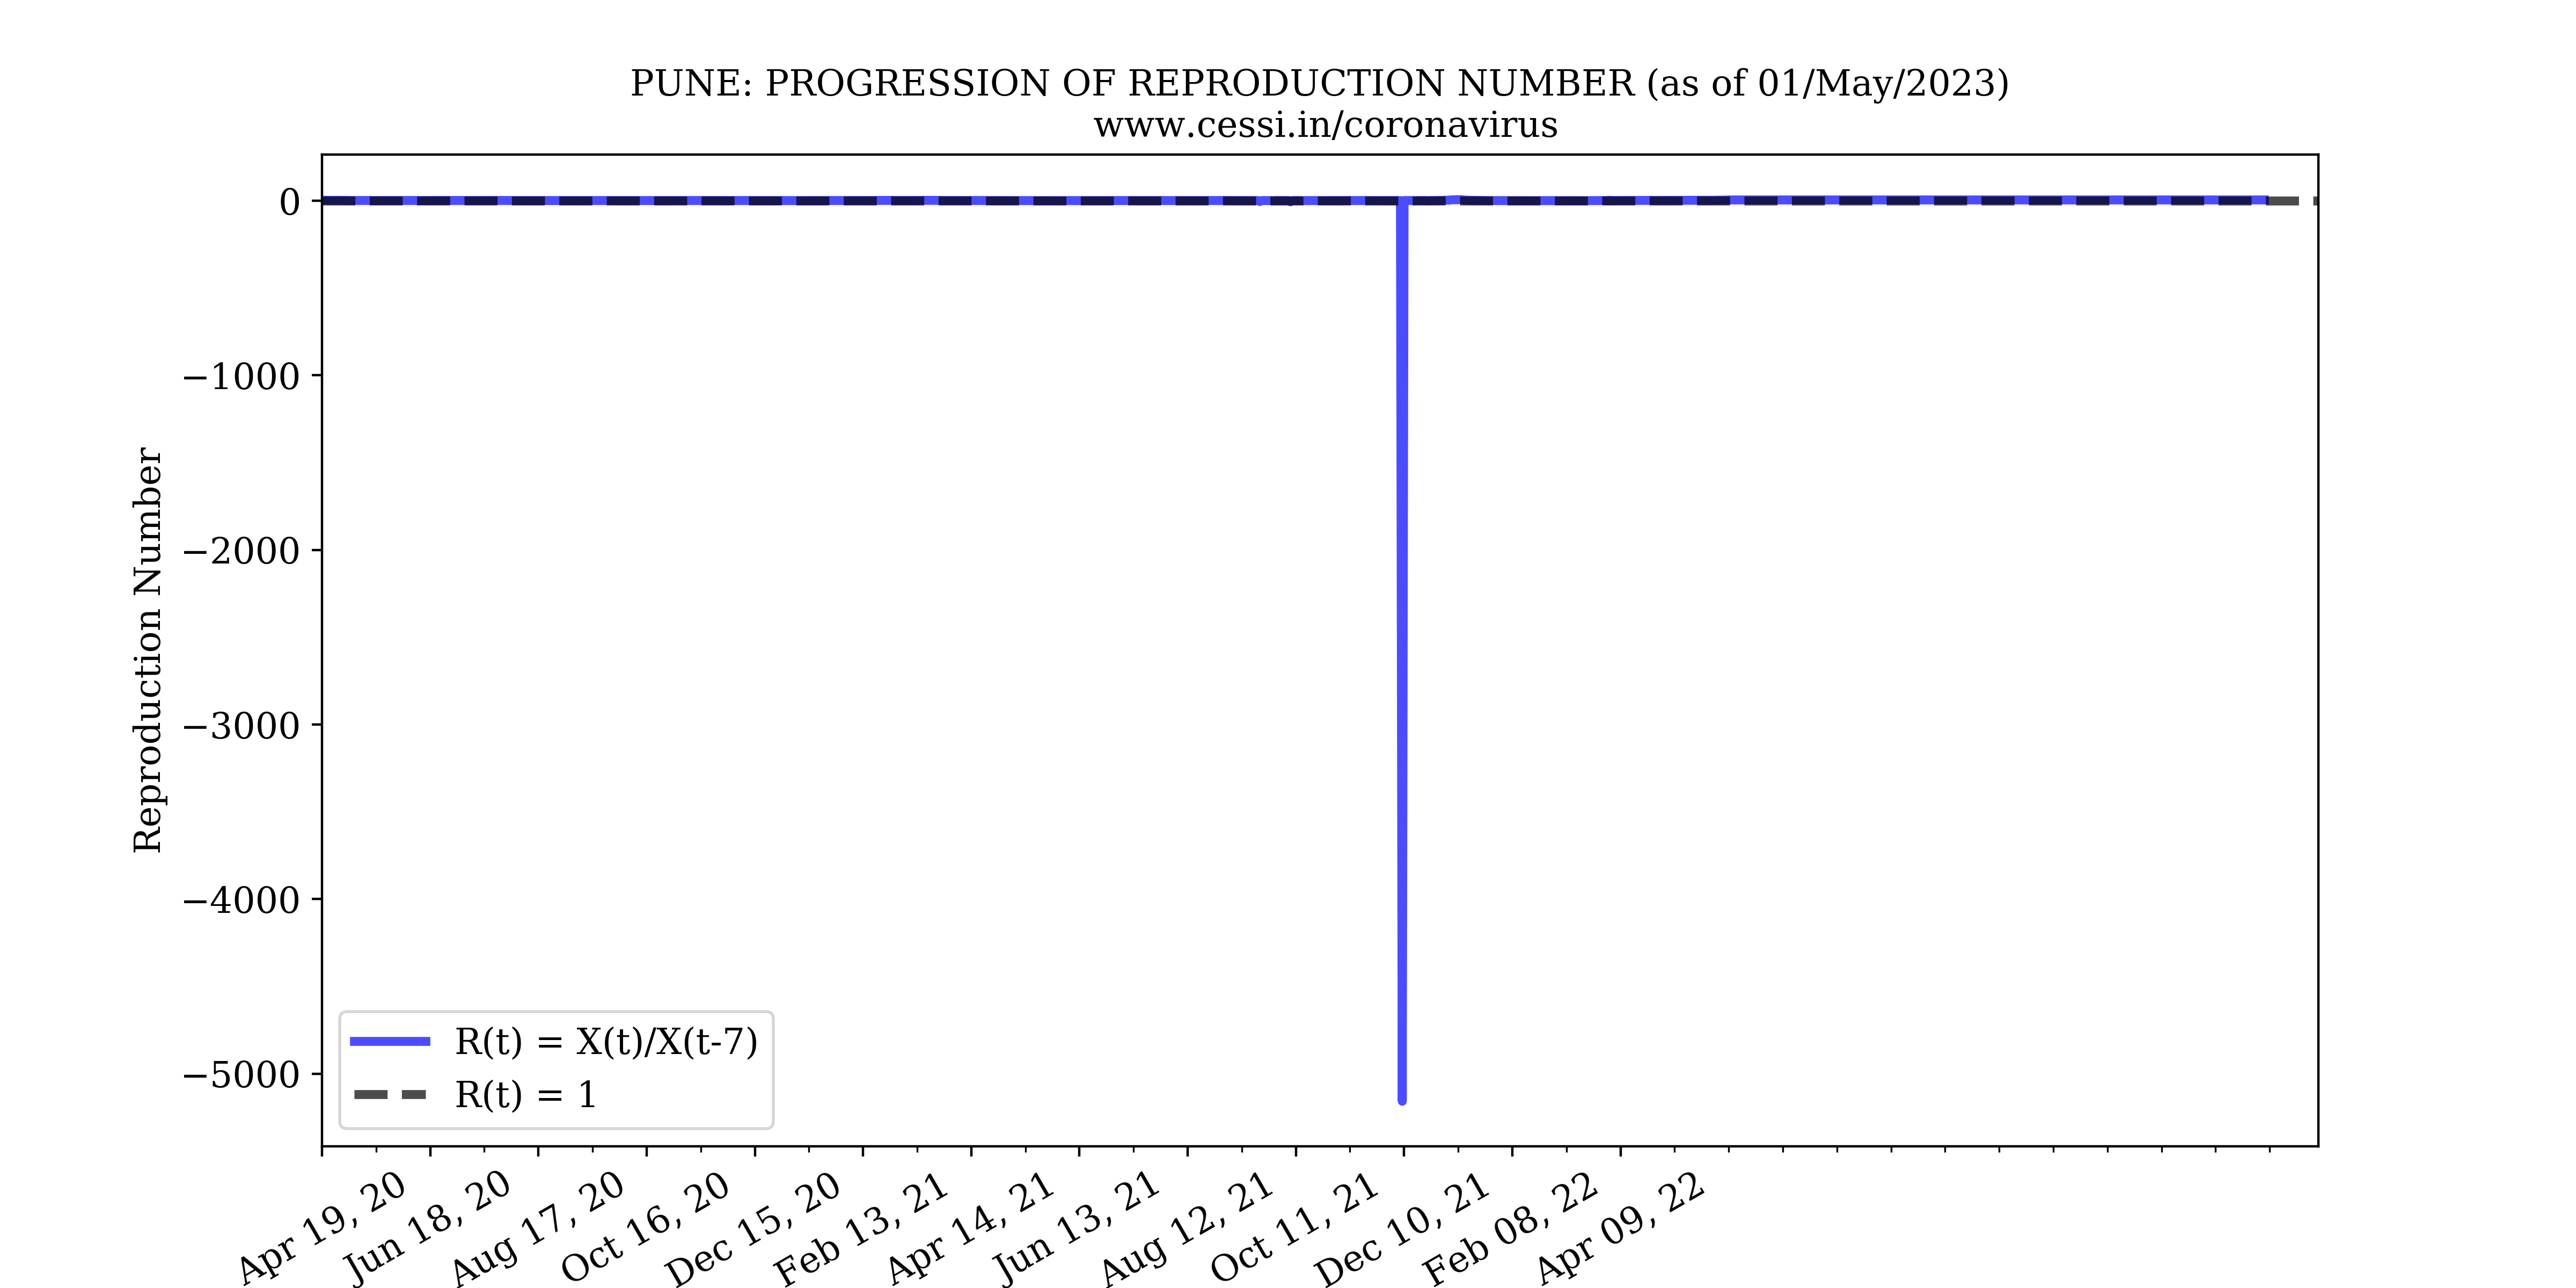
Progression of reproduction number(R) for Pune
The plot shows Reproduction number versus time. Reproduction number(R) is the number of people infected by a single infected person. The Reproduction number below 1 is desirable to slow the spread of the virus. This is how we estimate the reproduction number.
Let X(t) be the number of active infections at time (t), where t is a particular day. Then, the number of people infected by X(t) is given by R(t)X(t). For example, if R(t) = 1, then X(t) will infect another X(t). Assuming that it takes 7 days for symptoms to manifest,
R(t) = X(t+7)/X(t). This can equivalently be described by R(t) = X(t)/X(t-7). This is plotted in blue.
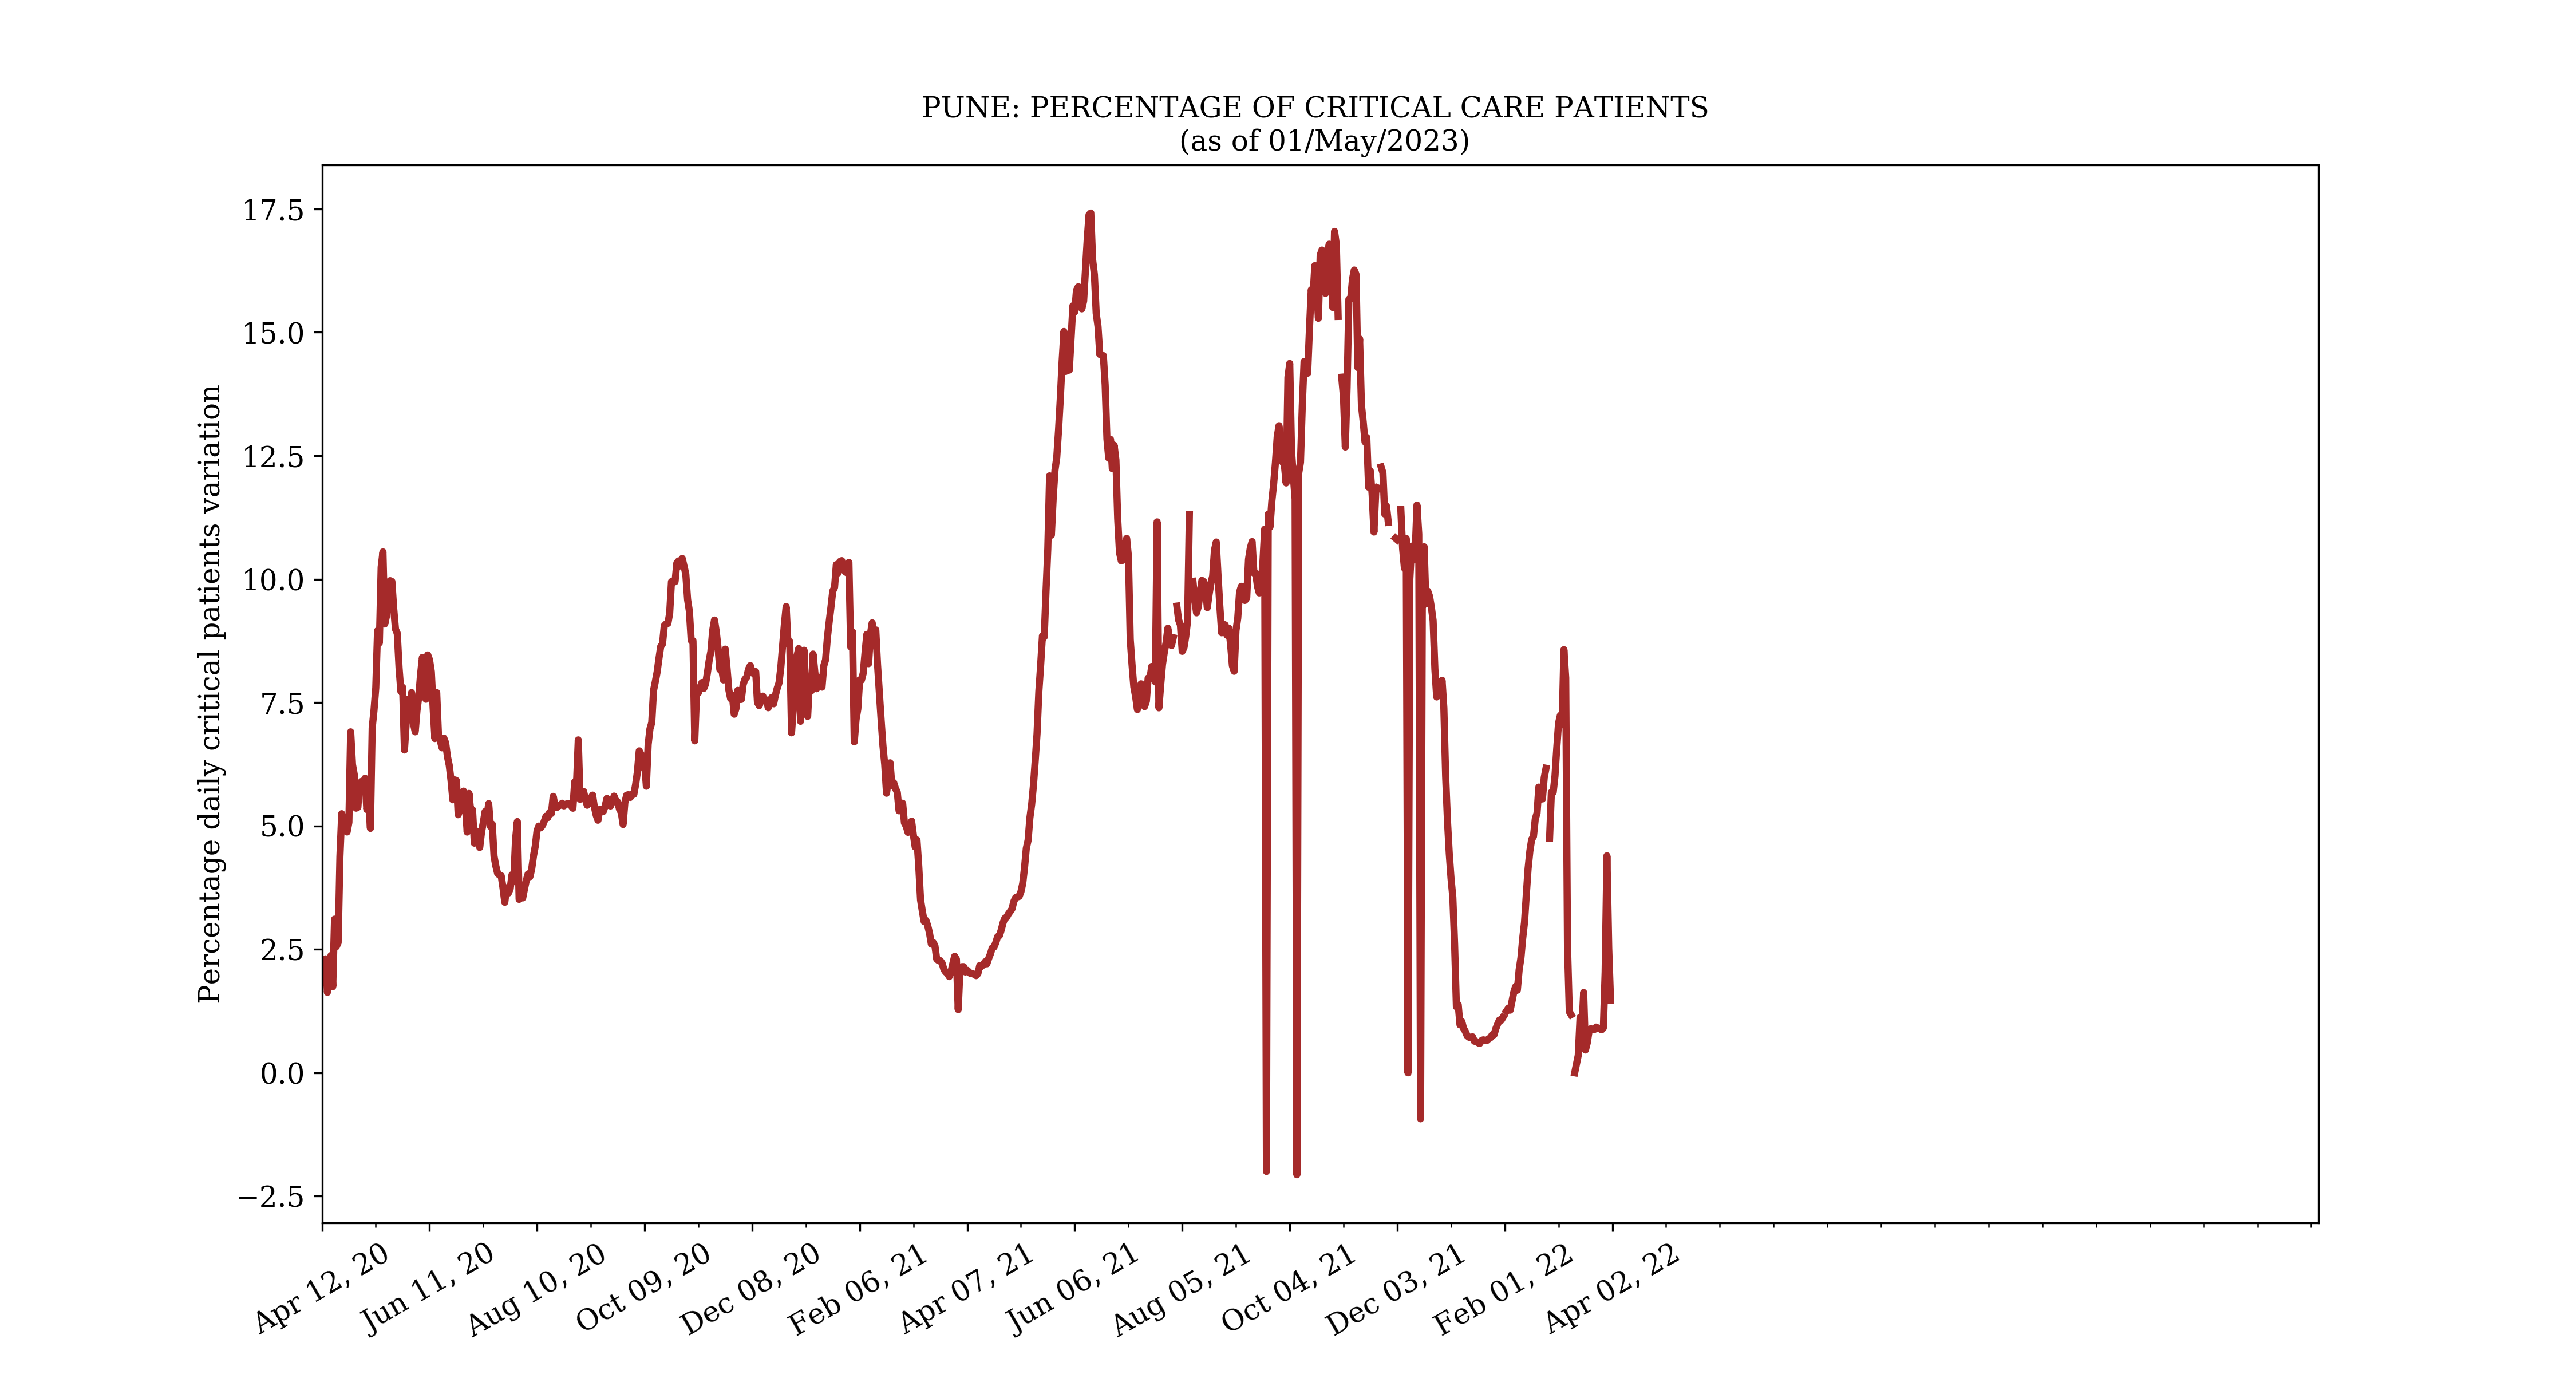
Percentage of critical care patients
How this quantity is calculated: 100*Number of critical patients/total number of active cases in the hospital.
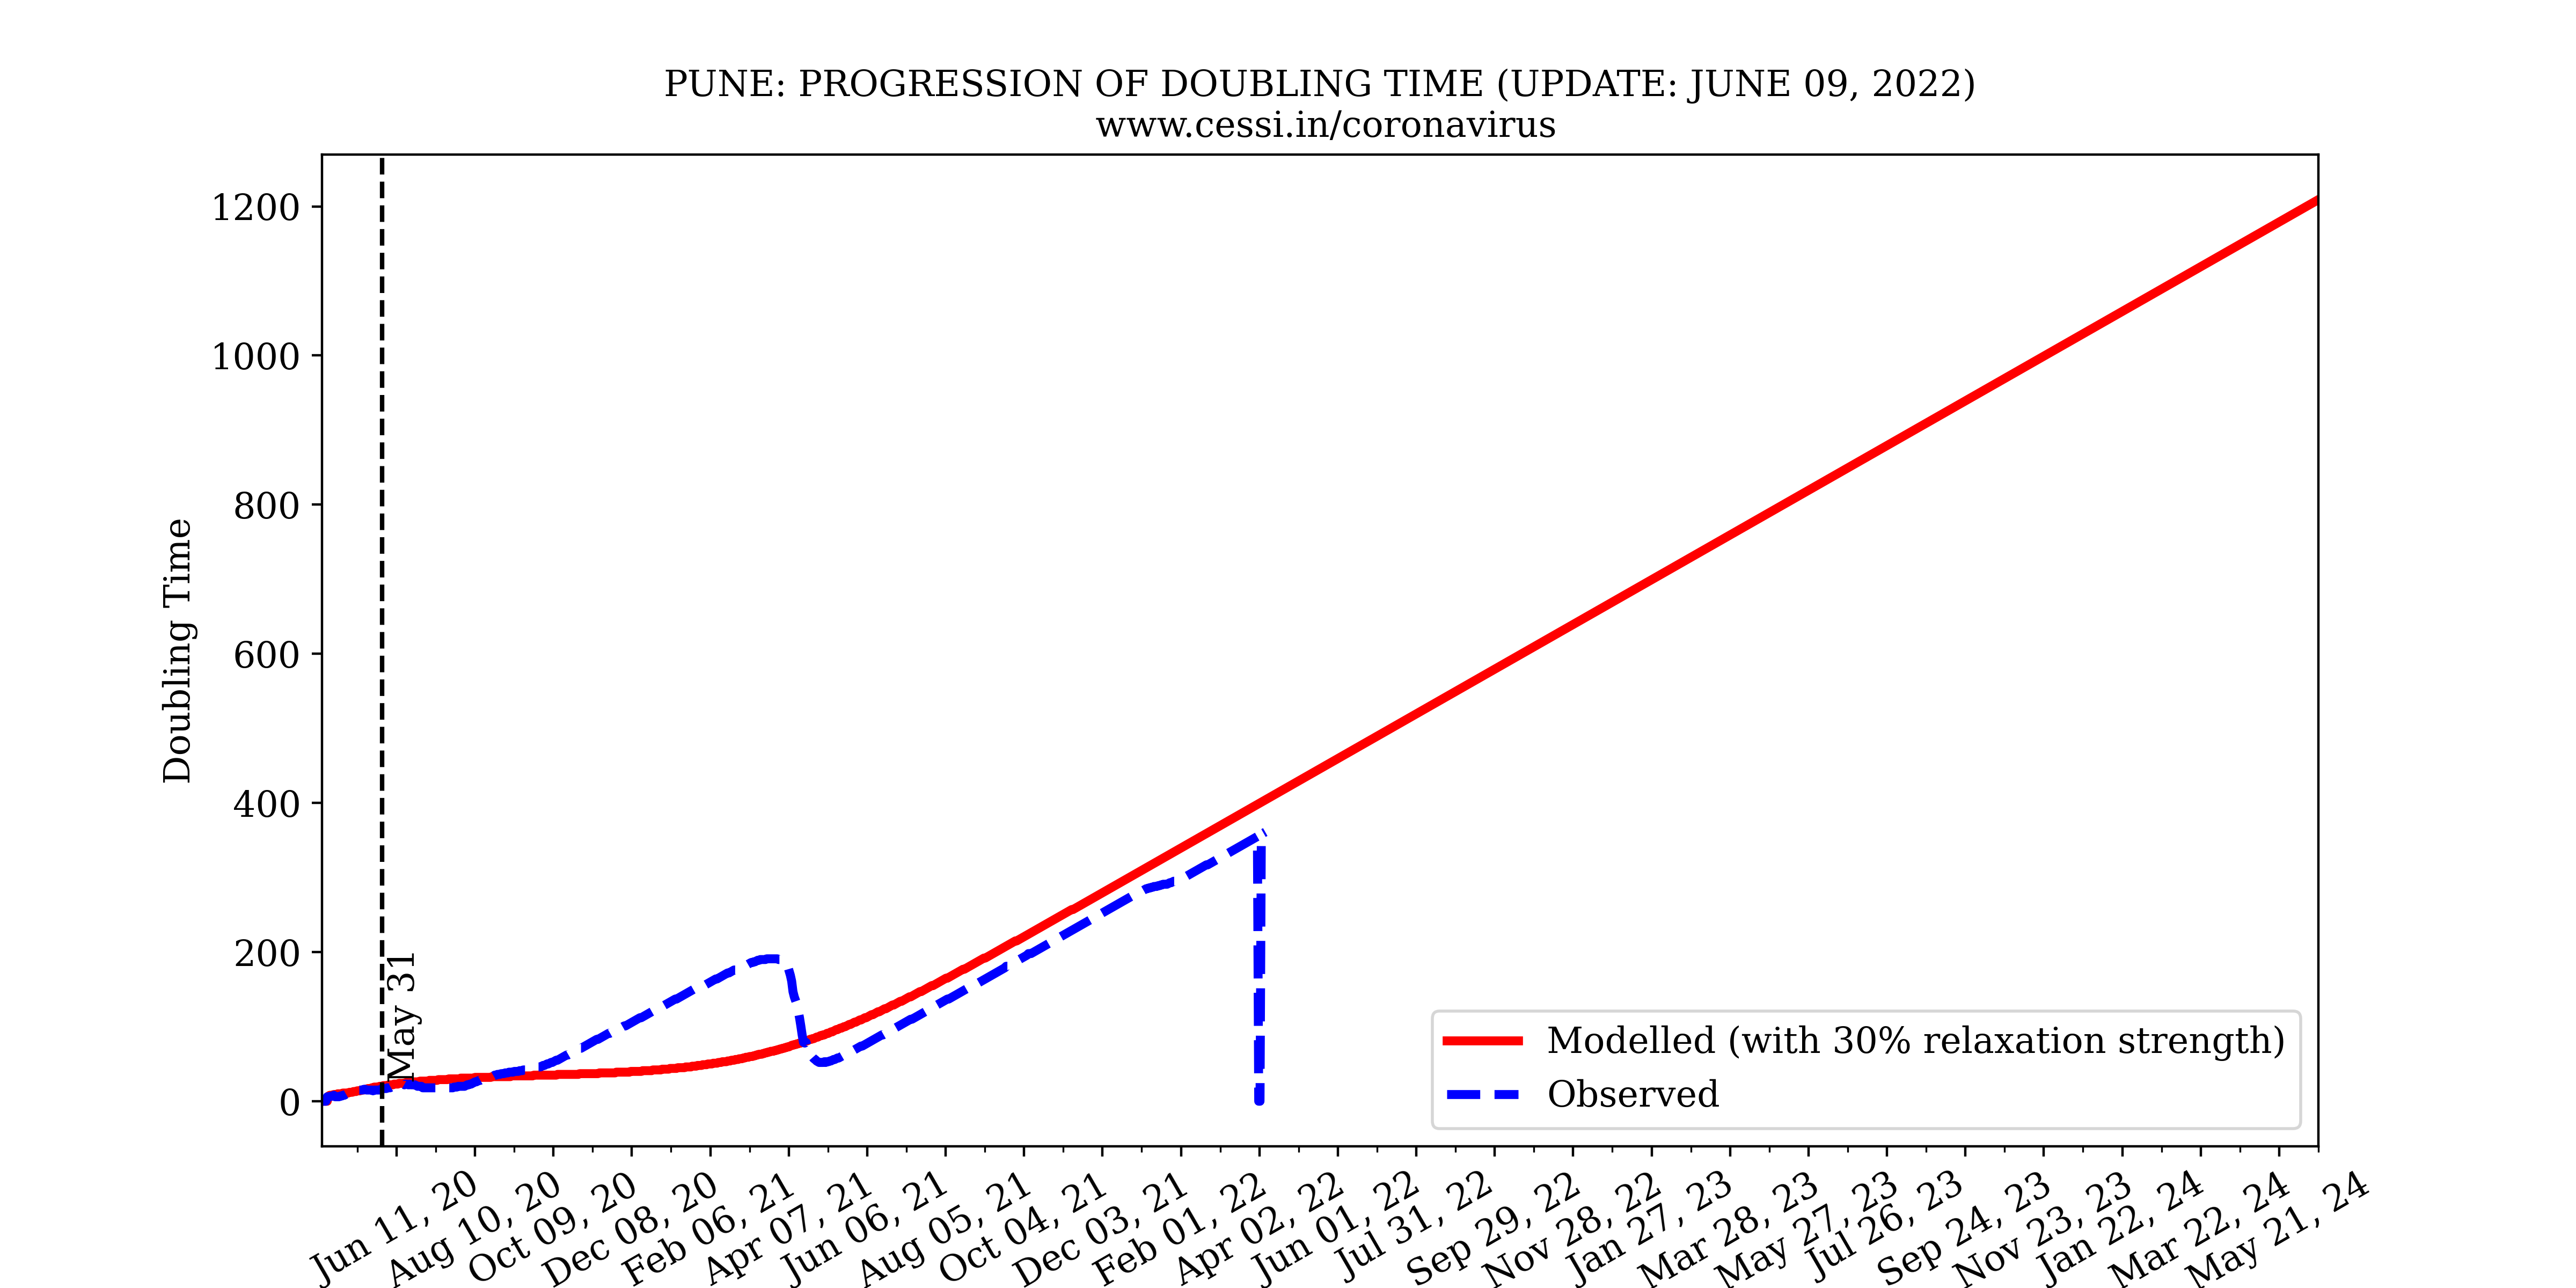
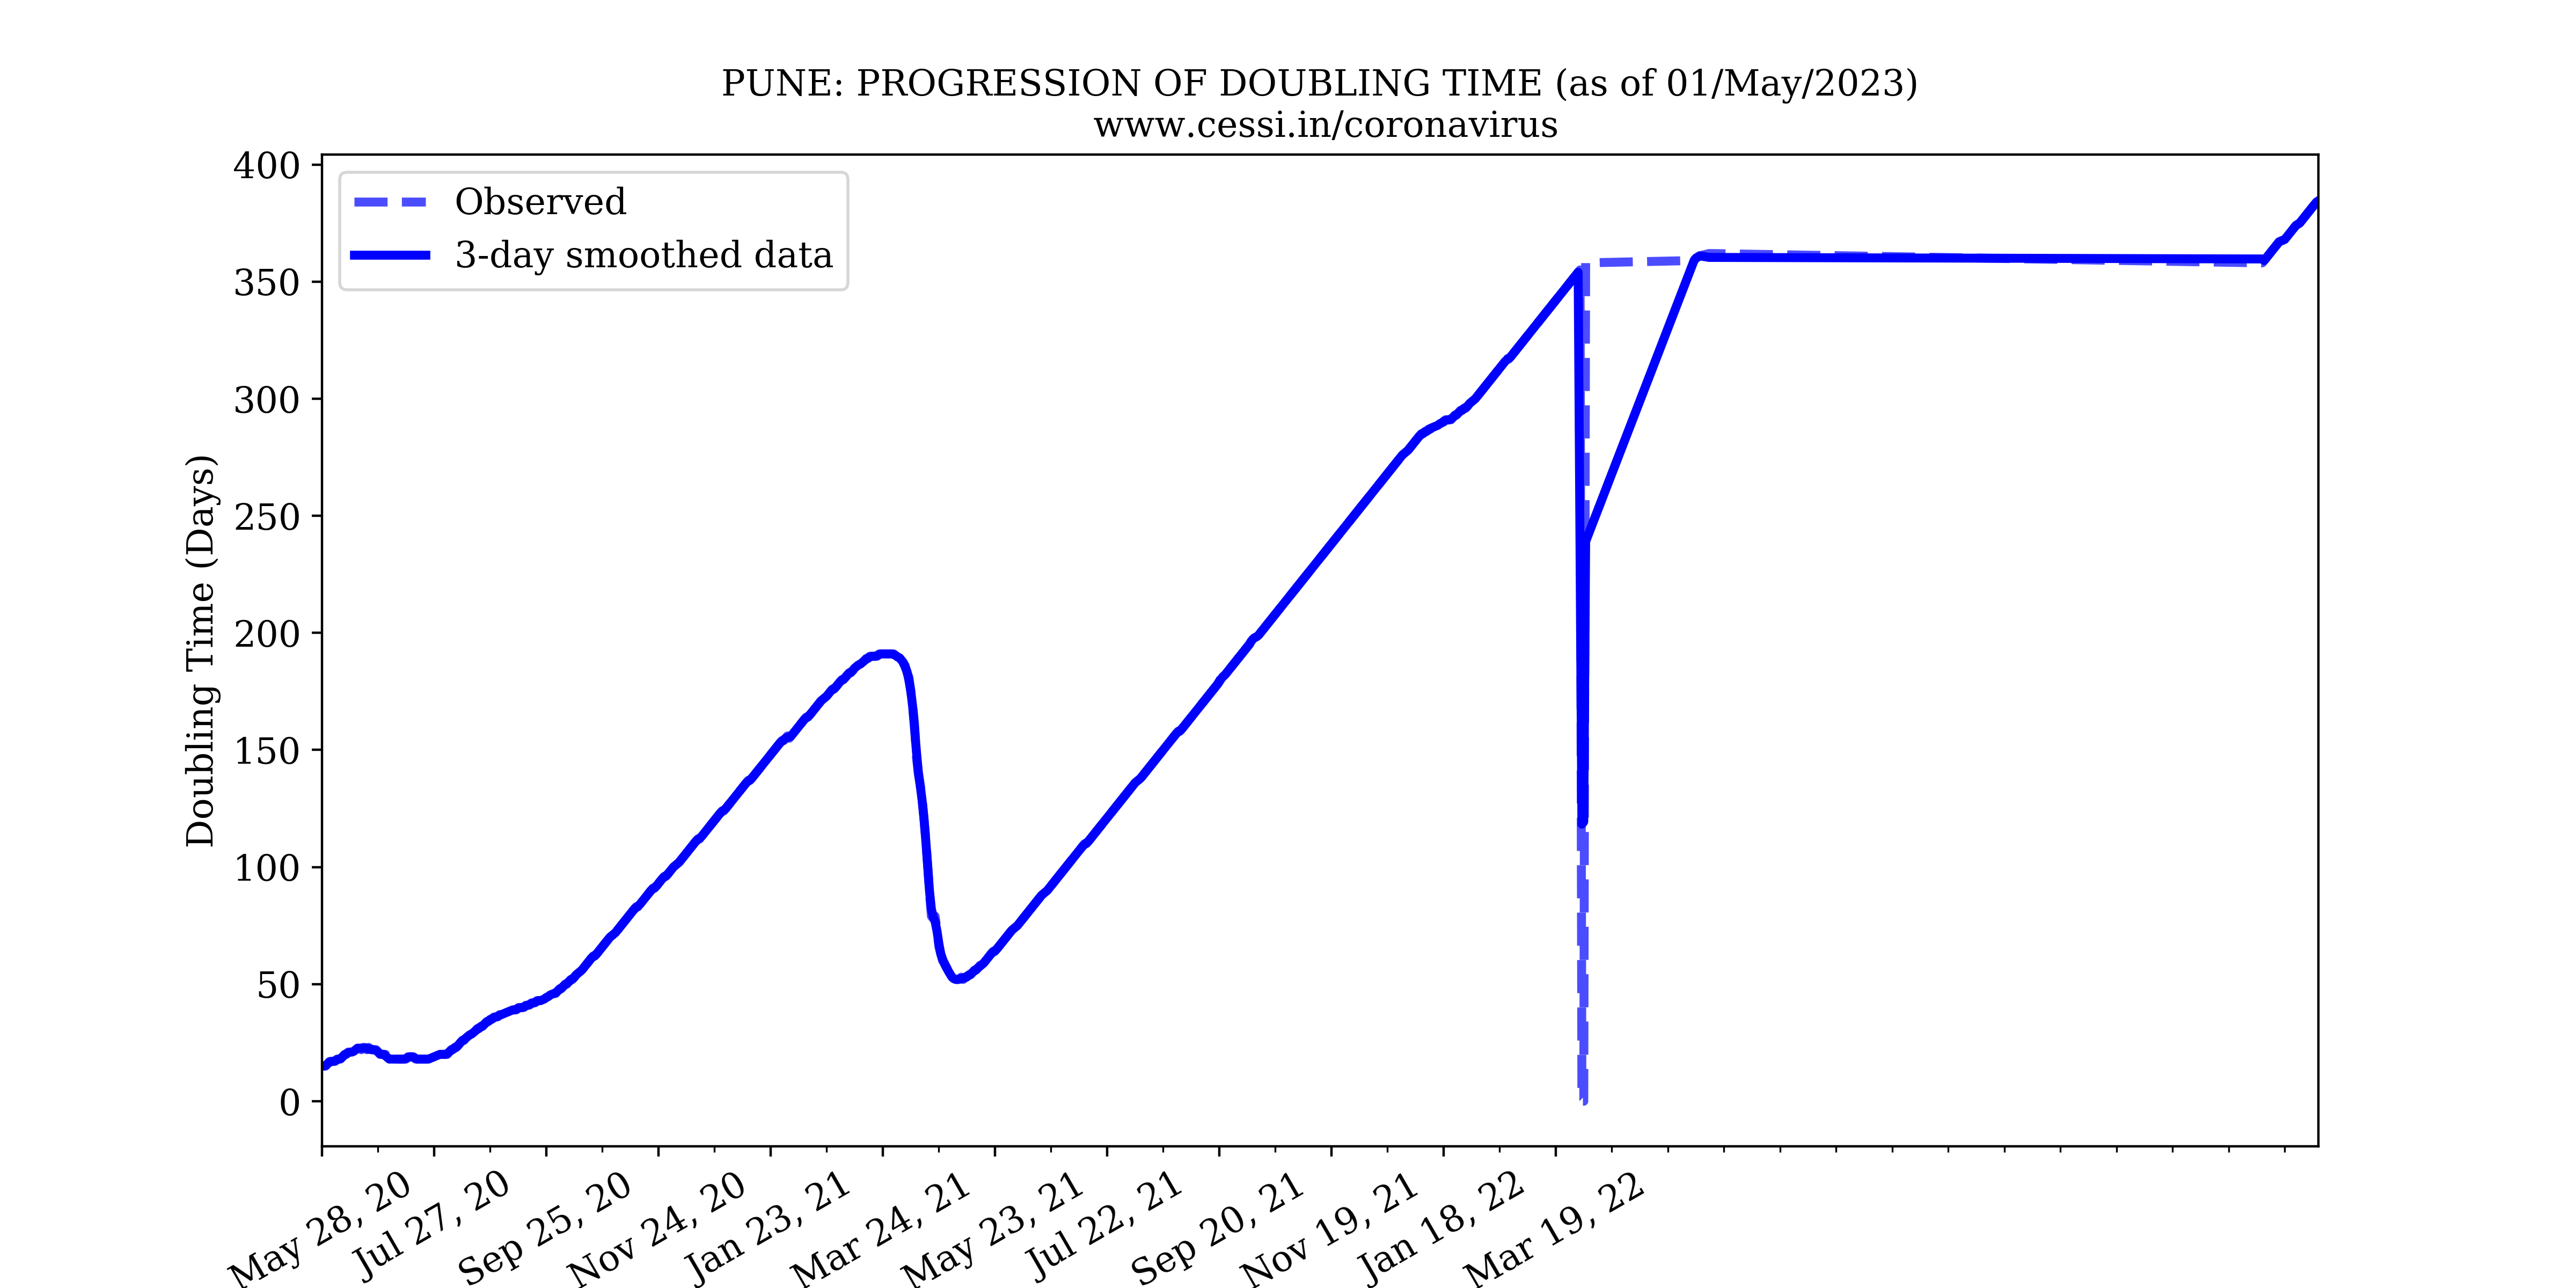
Doubling time for the COVID19 pandemic in Pune
Here is an example how the doubling time is calculated. If on day 14 the number of confirmed cases is 100 and it doubled up from 50 on day 2, then doubling time for this case is 12 days which is assigned to day 14 on the curve.
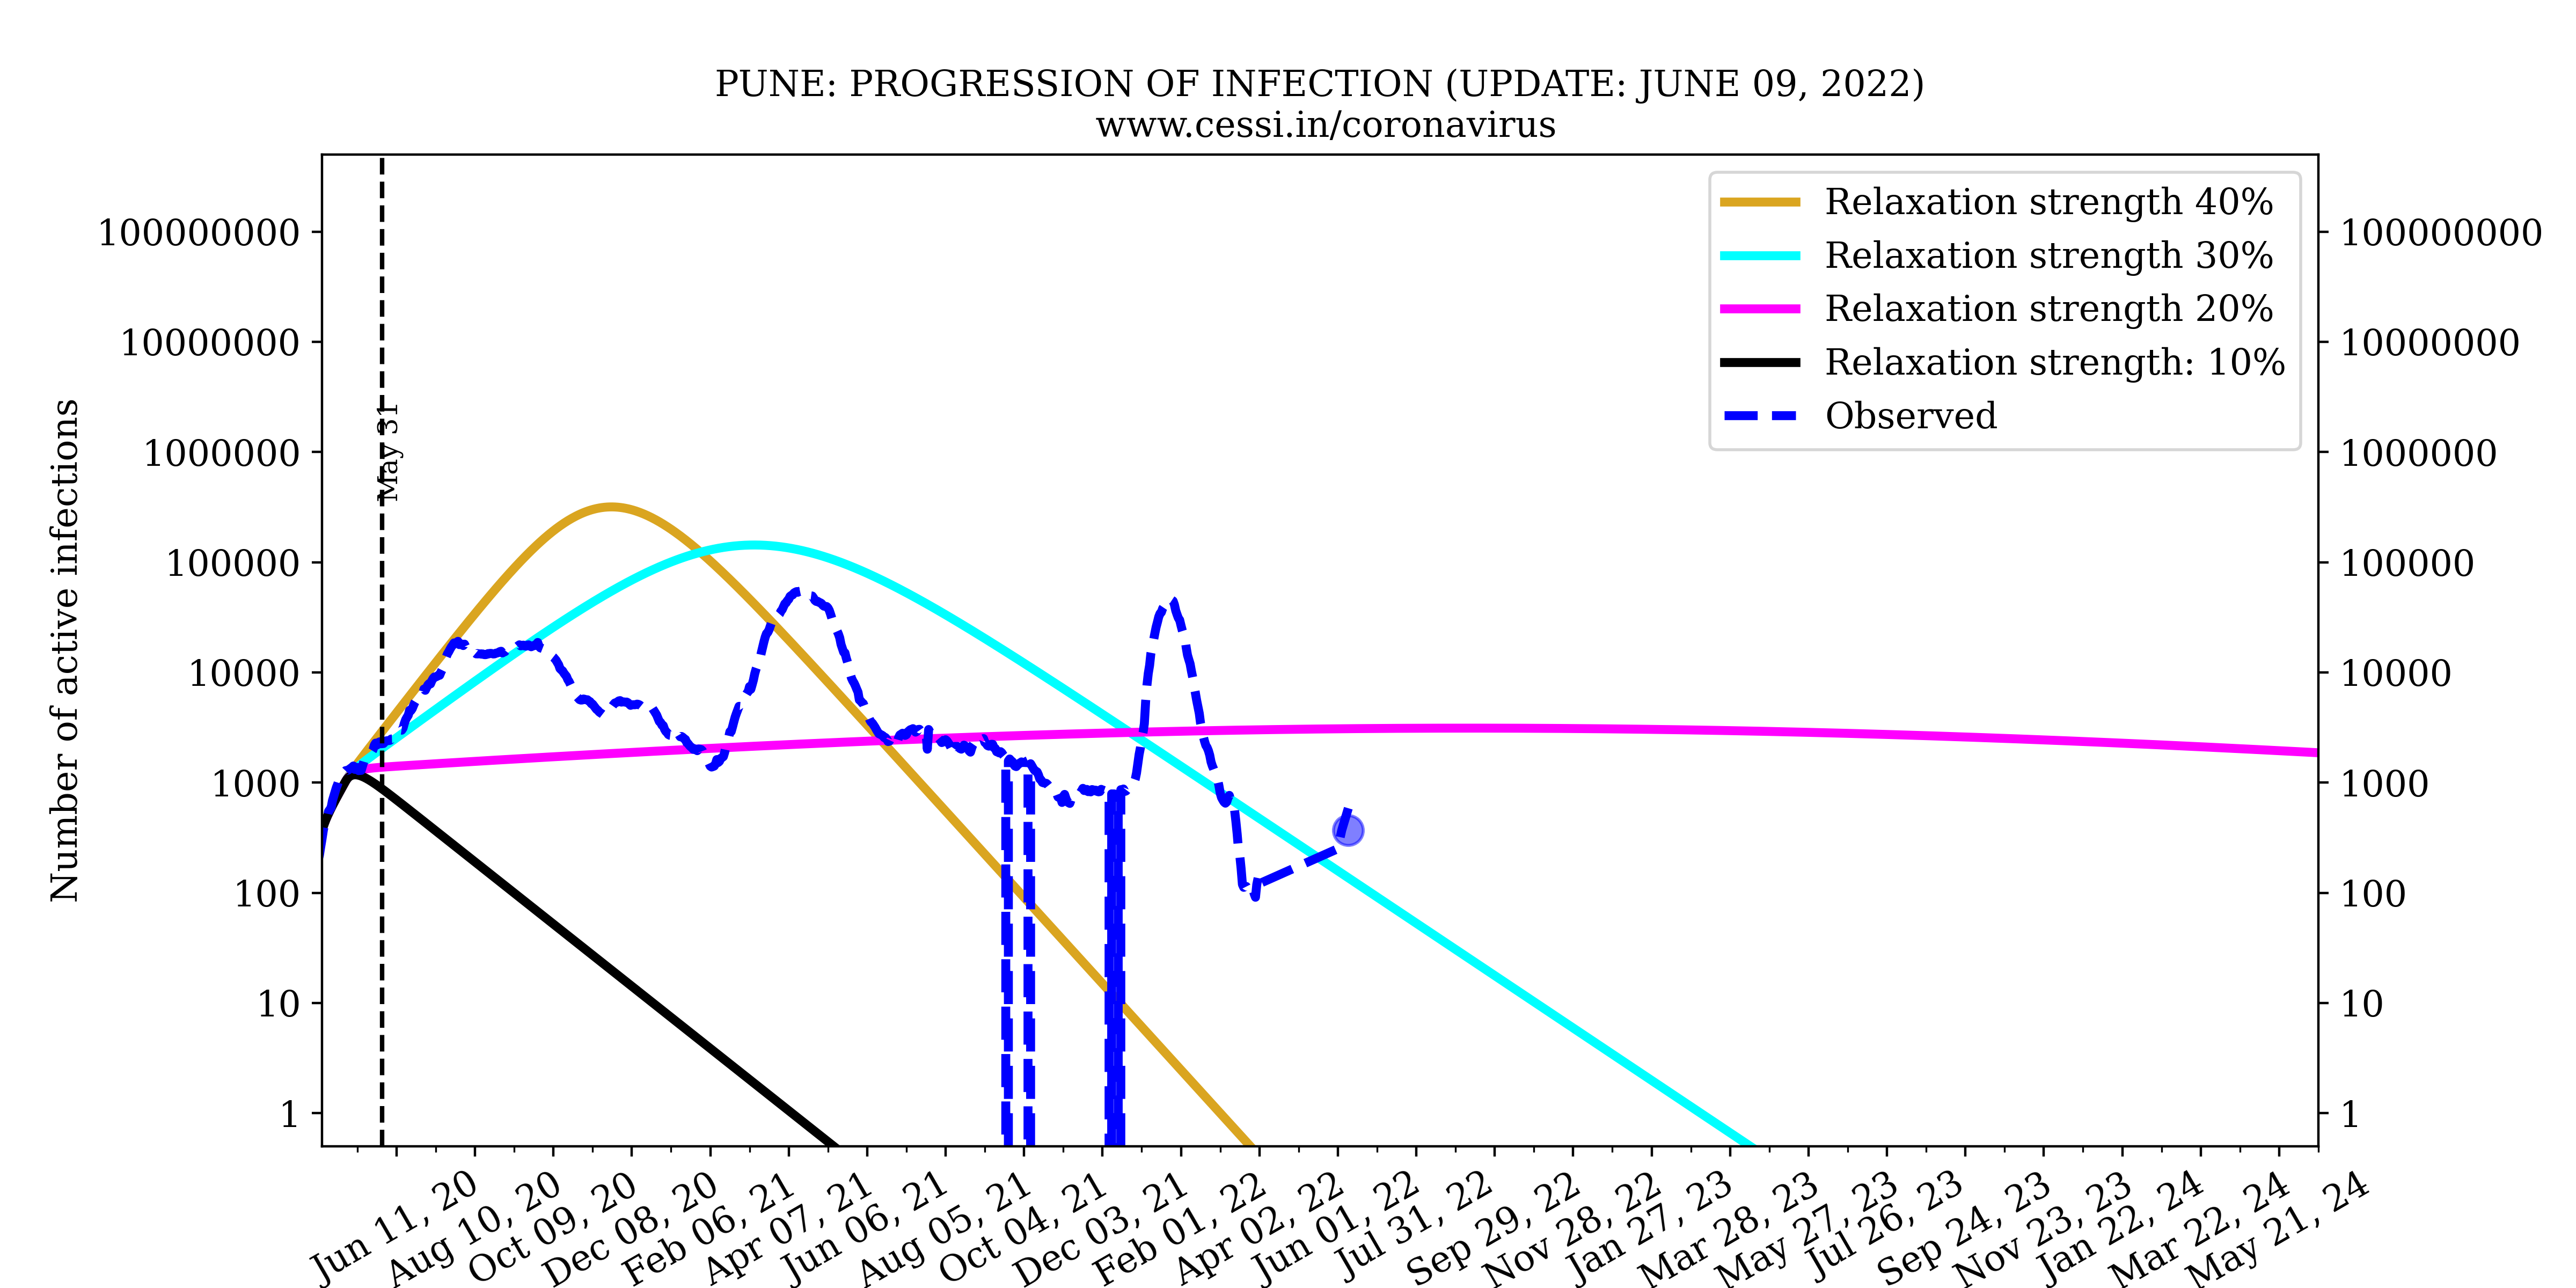
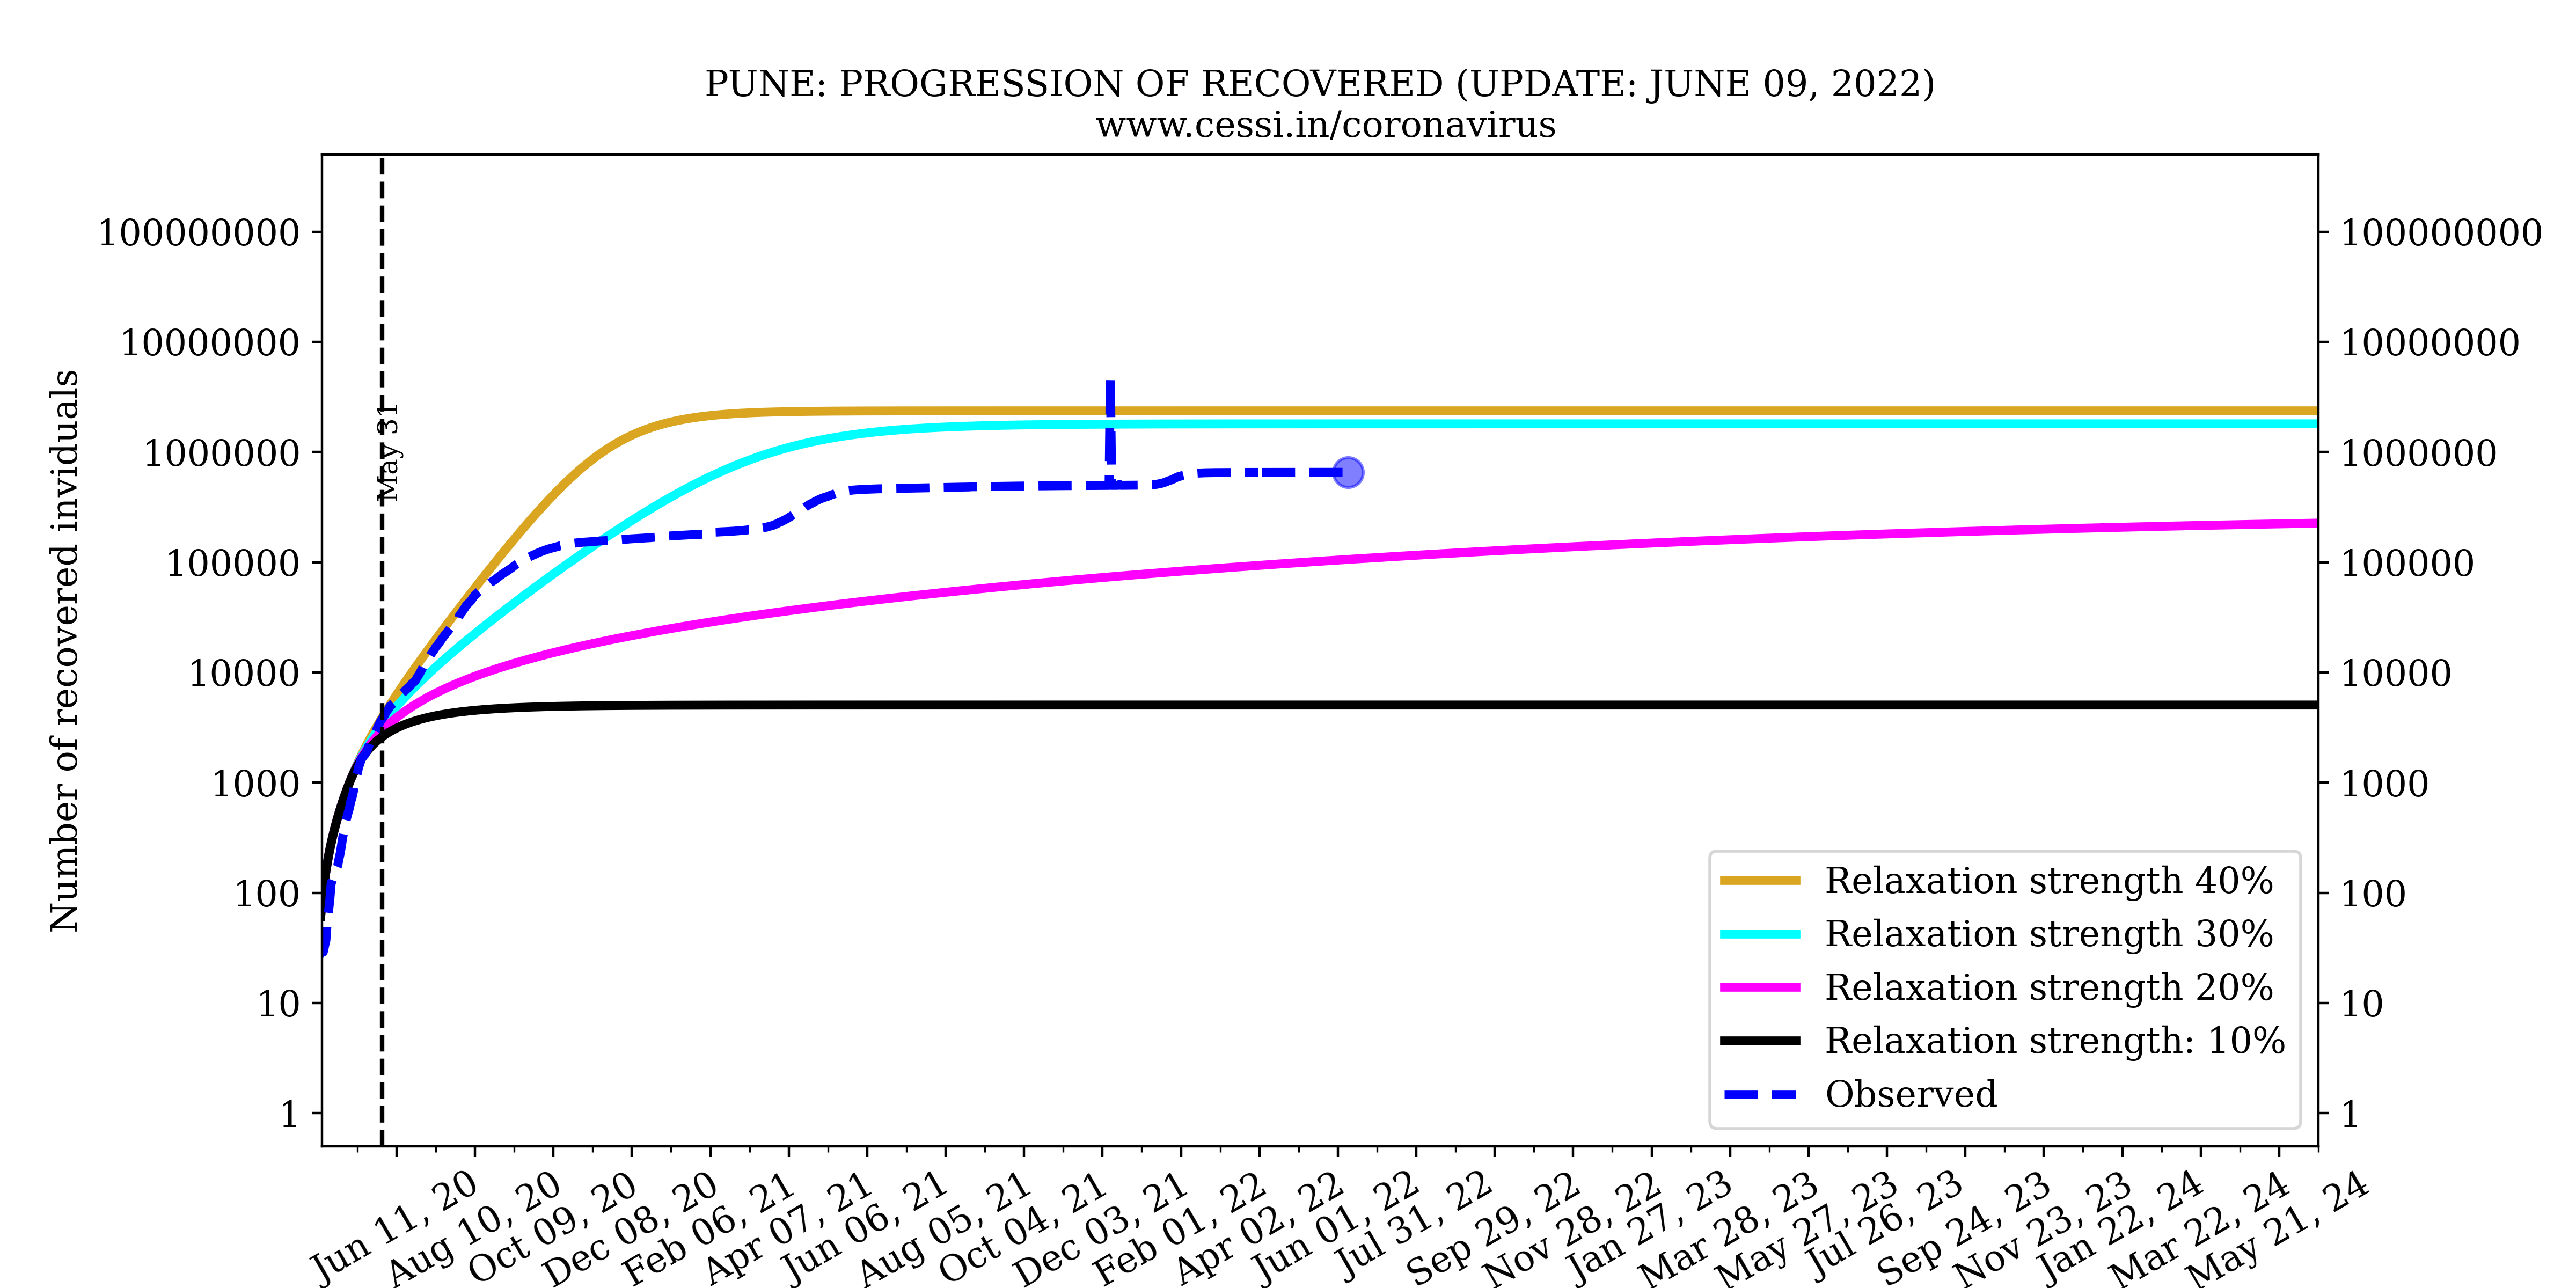
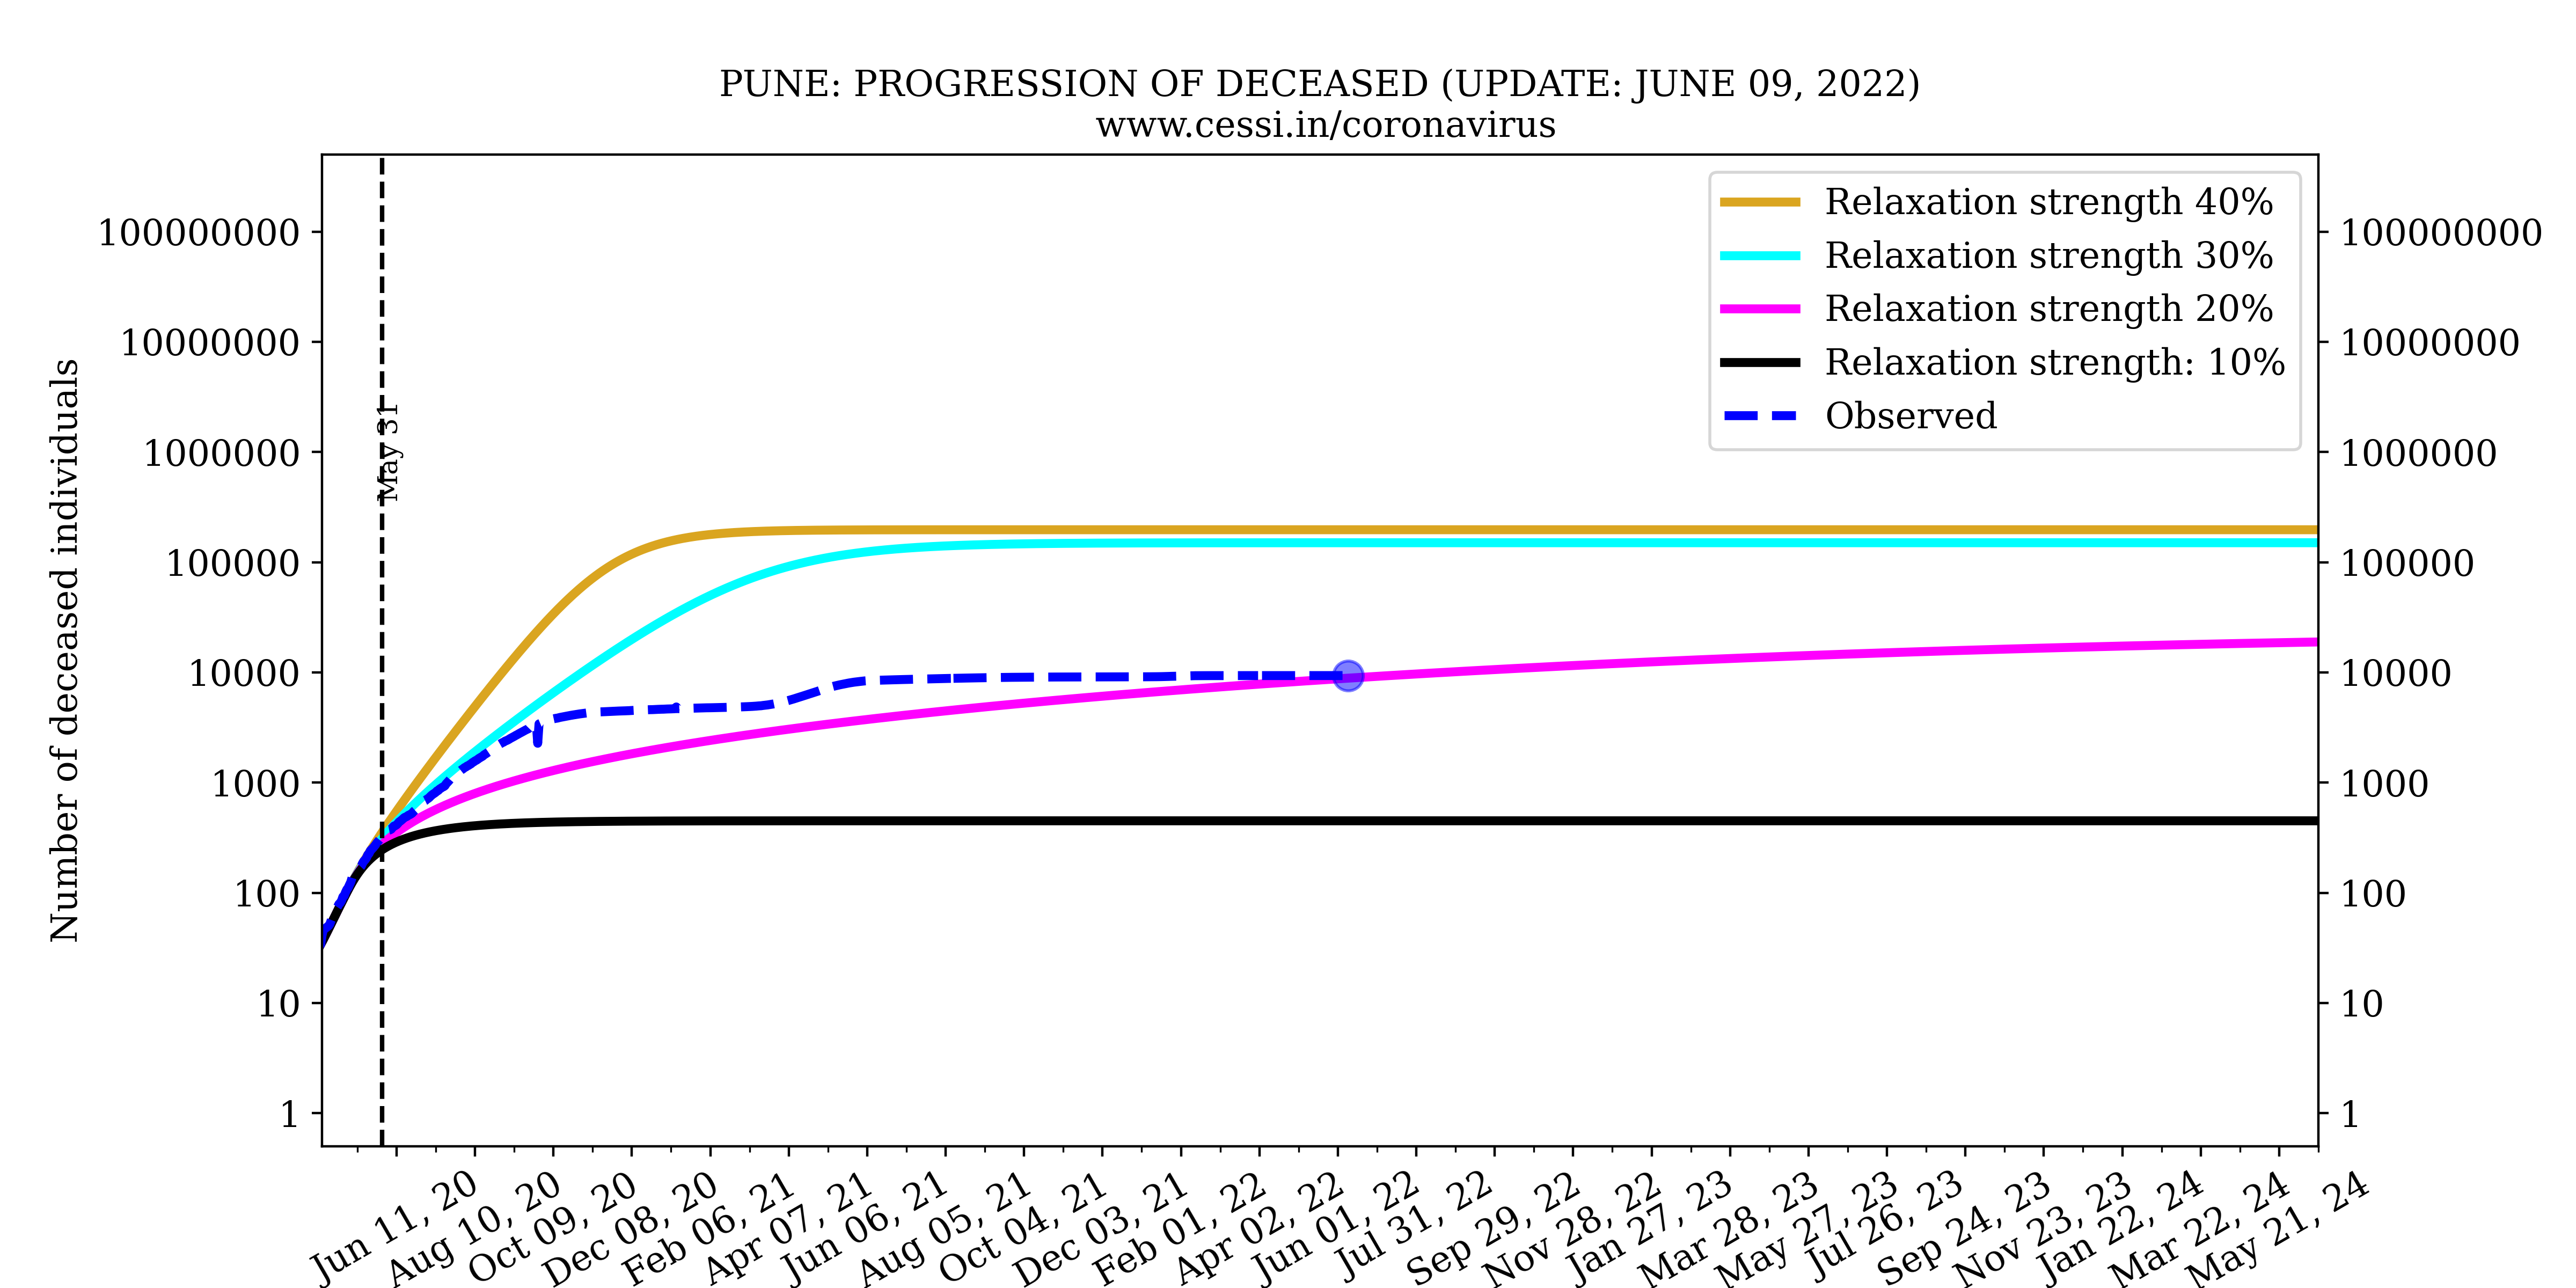
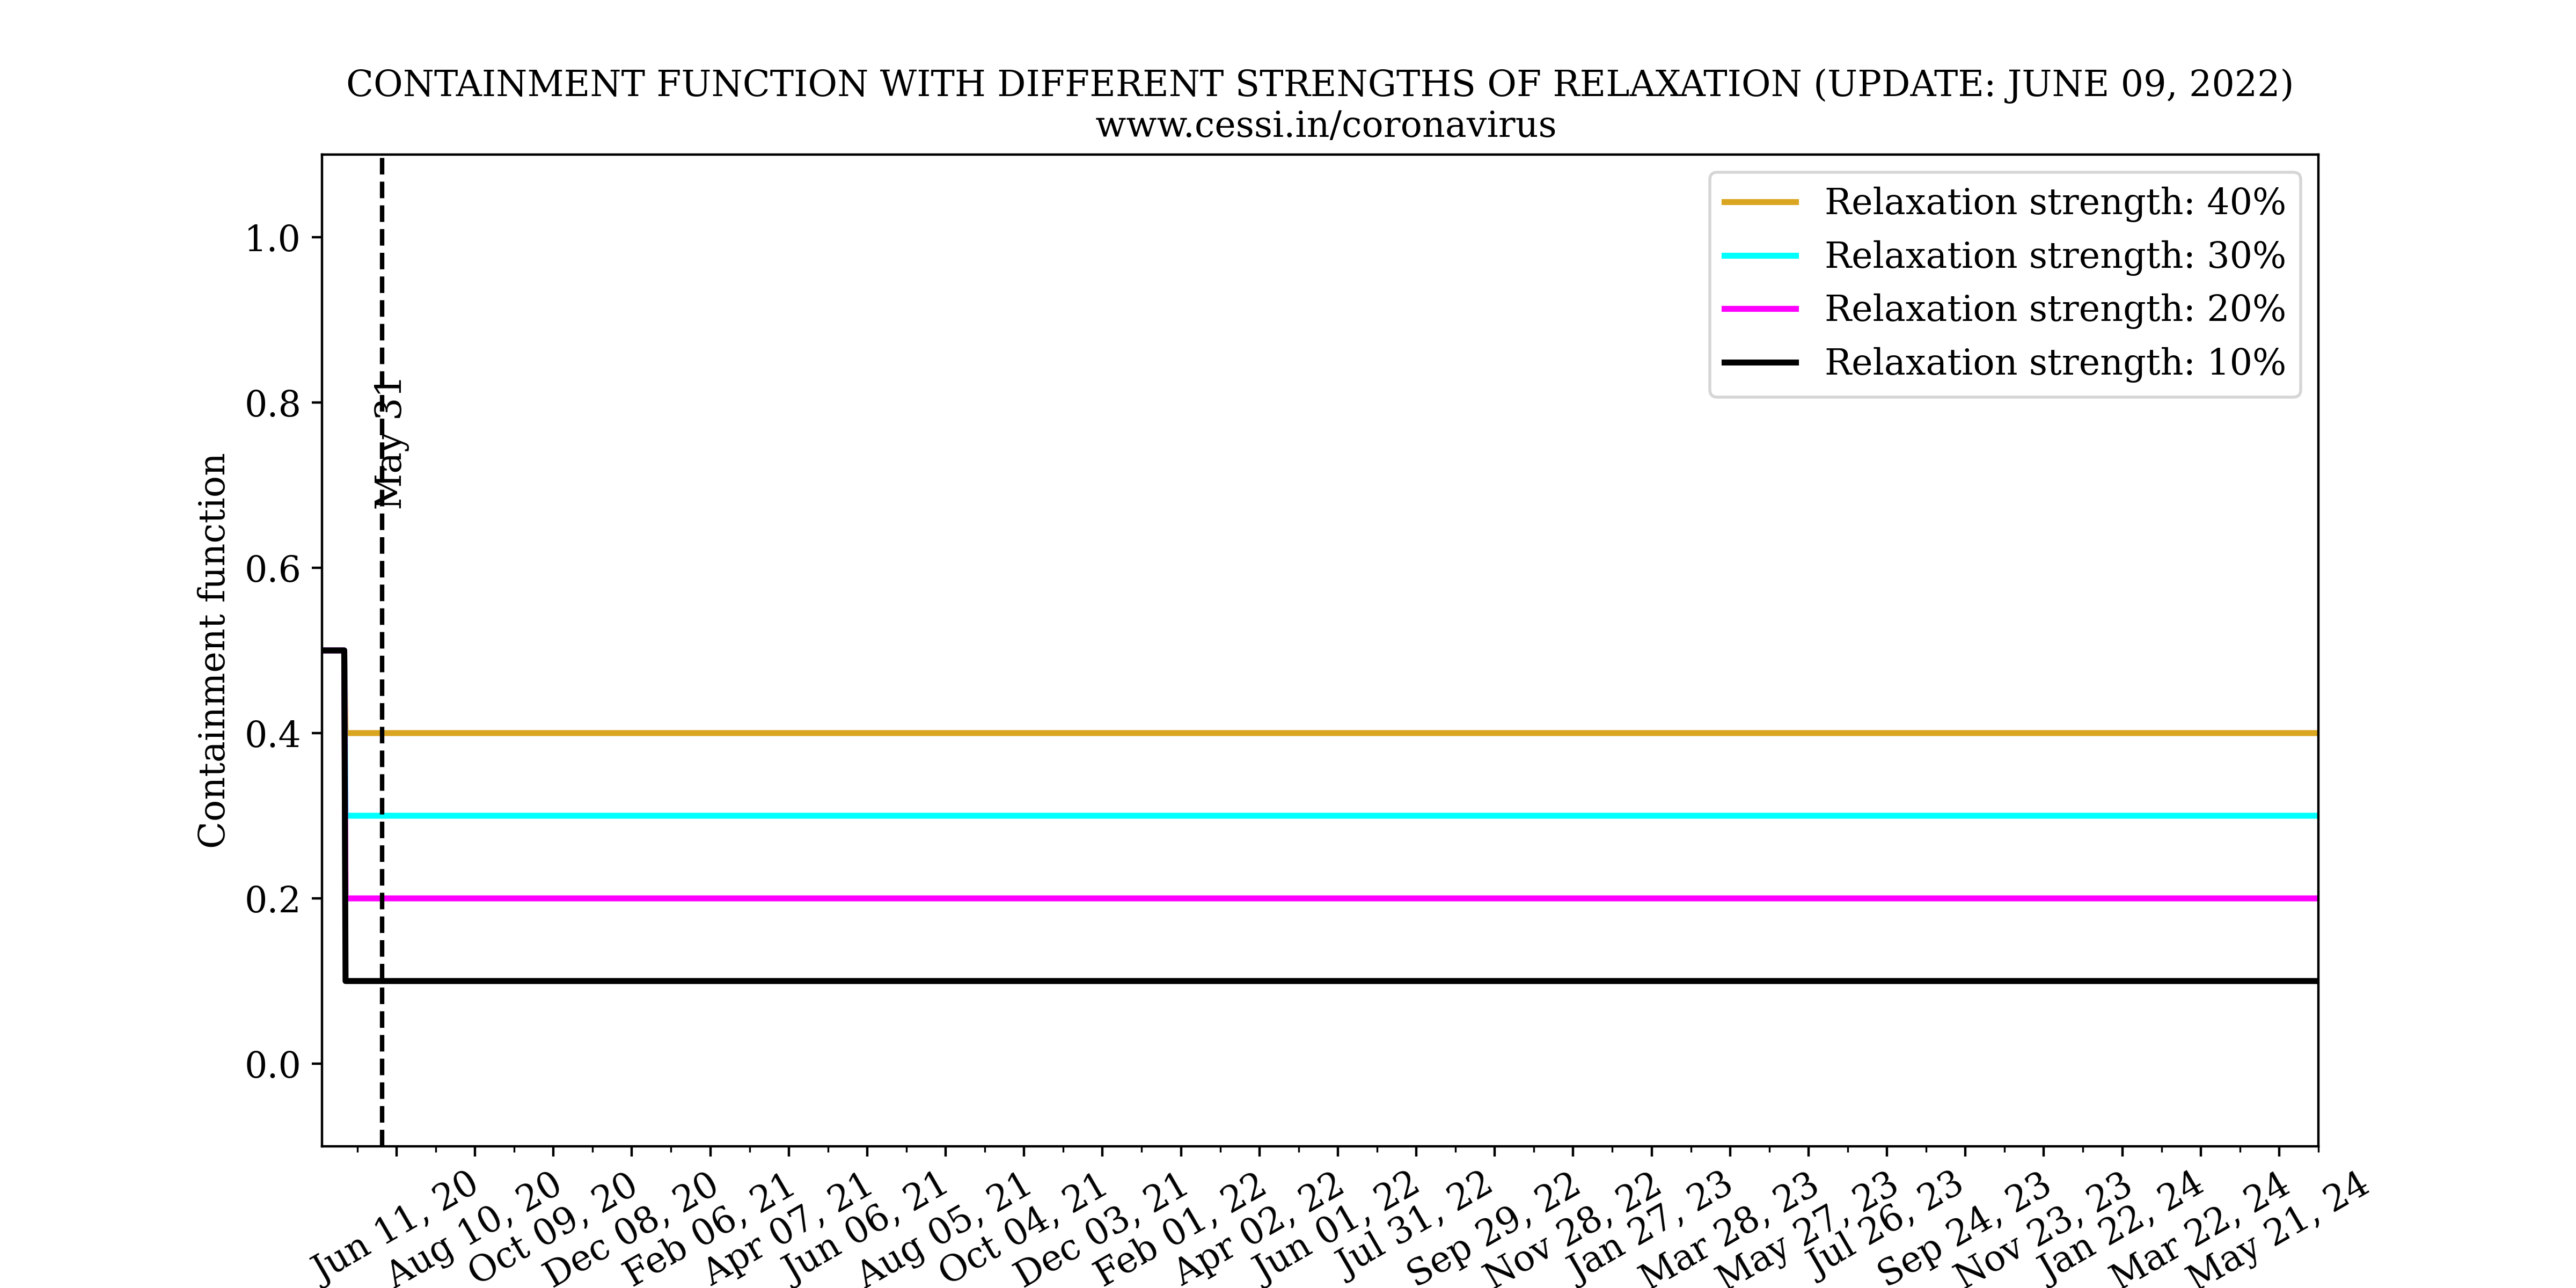
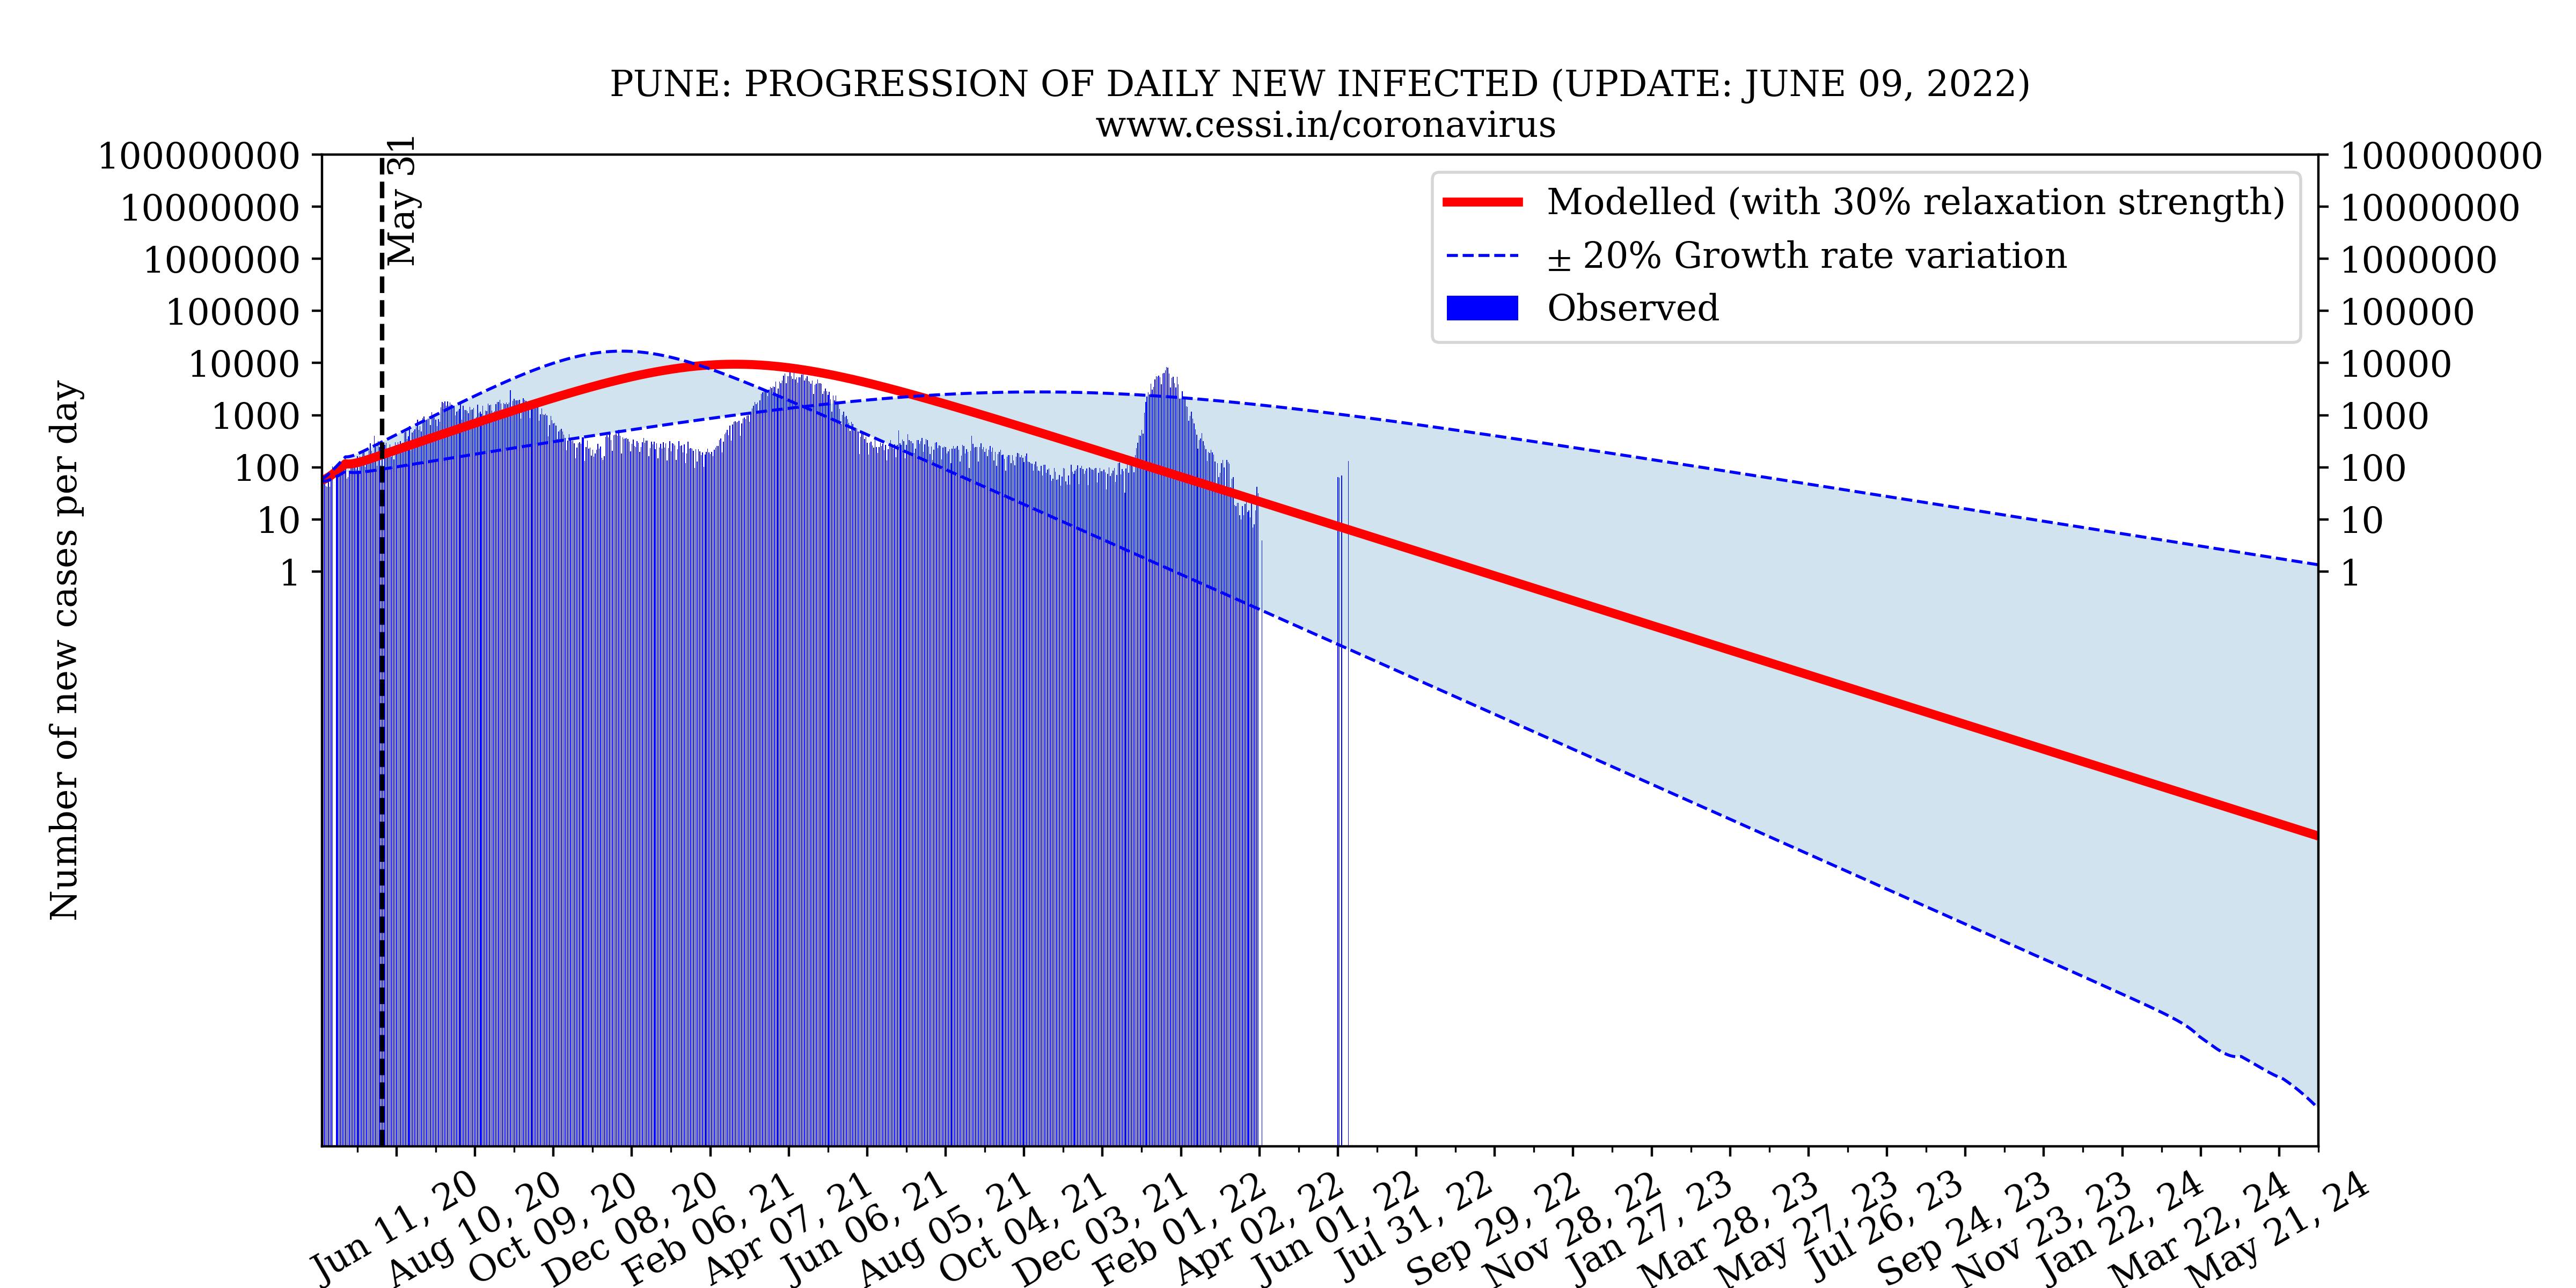
MODELLING THE COVID19 PROGRESSION FOR PUNE
These simulations are performed keeping all the values of the rates same as that for Indian context. However the initial conditions e.g. total population of the state, number of exposed, infected, recovered and deceased individuals are taken from the available observed data. Since first Indian lockdown started from 25th March 2020, the simulation starting date is choosen to be 18th March 2020 (because the data is available from 14th march onwards).