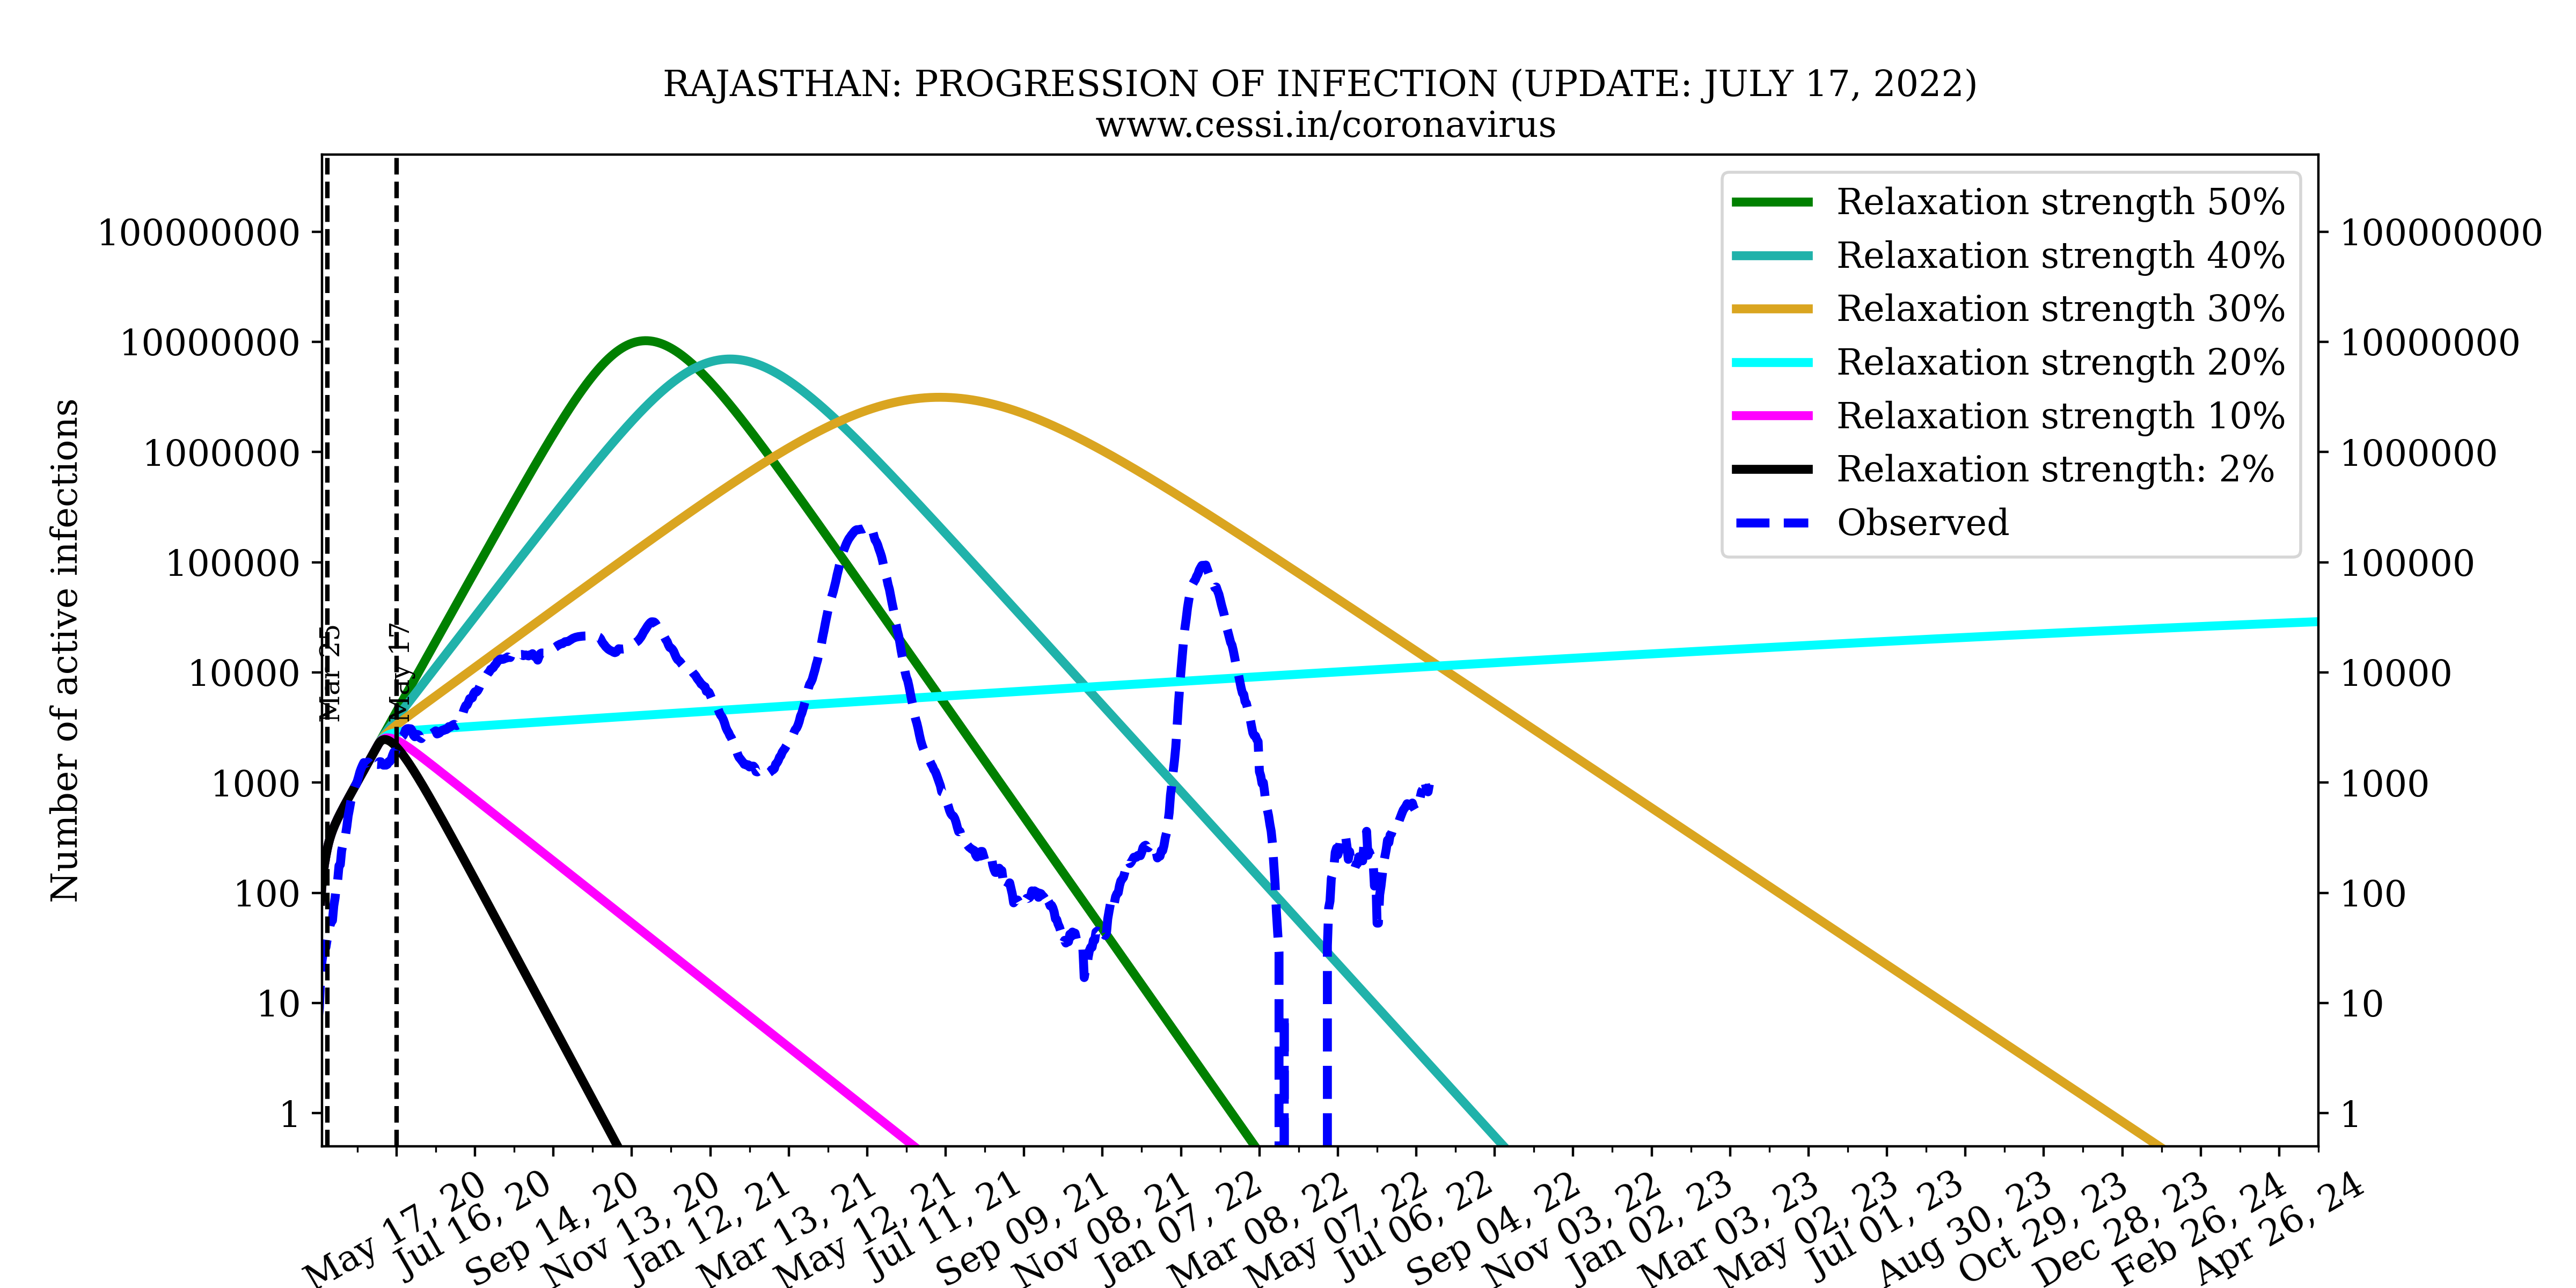
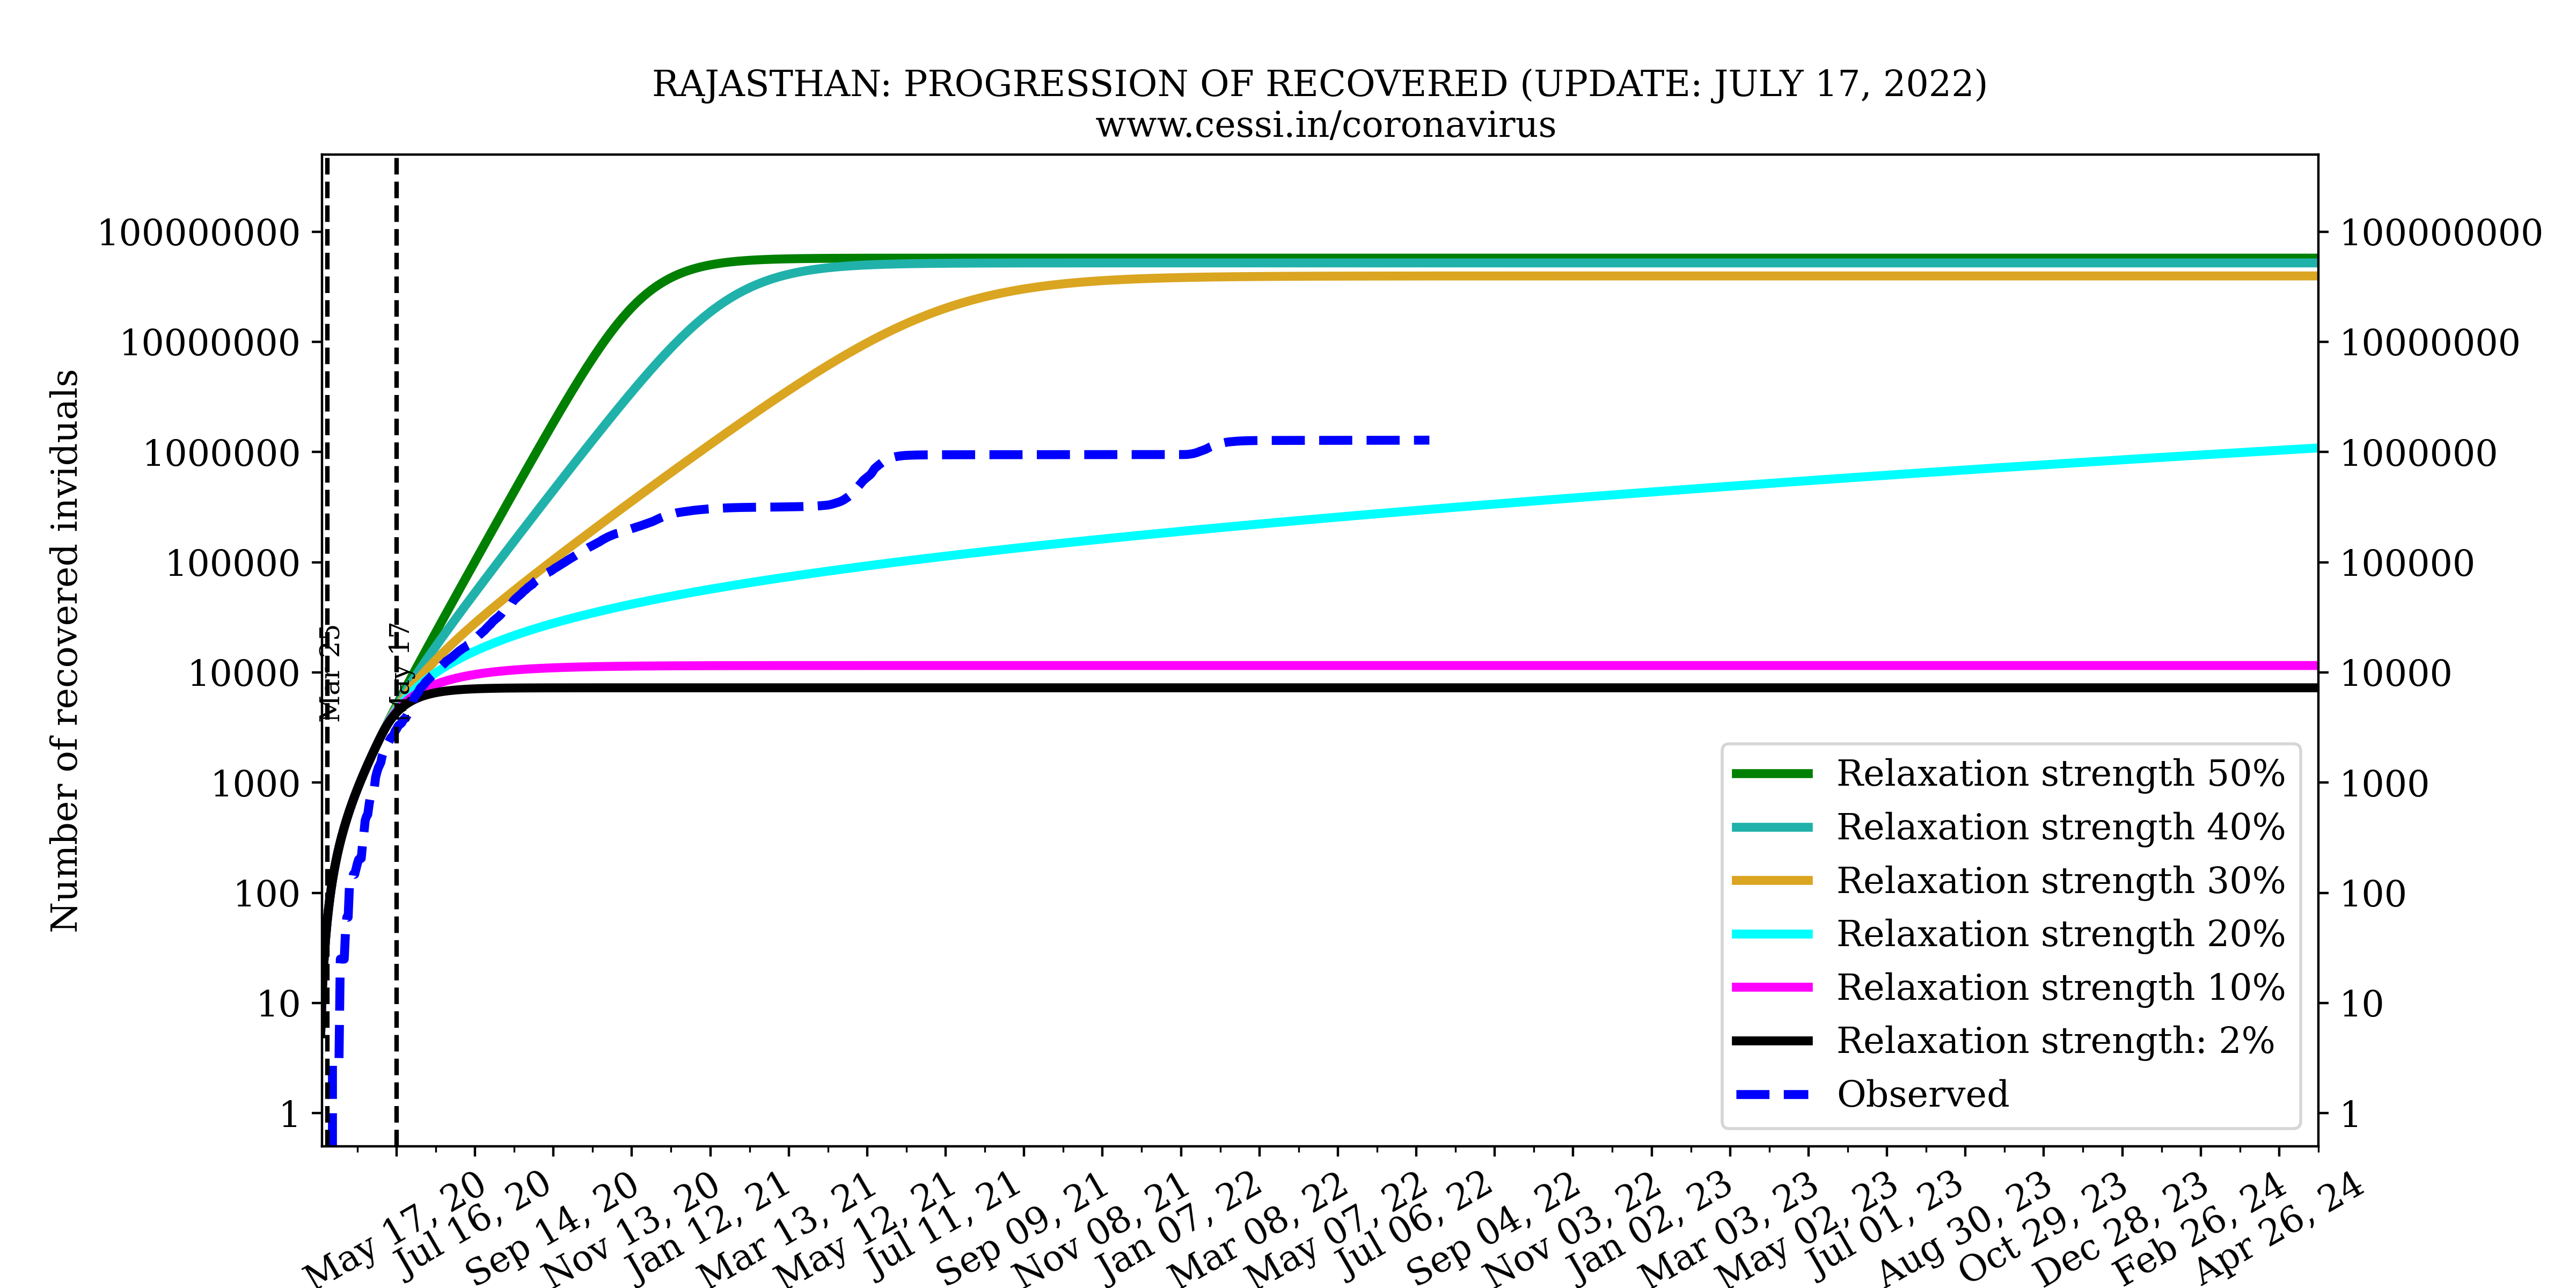
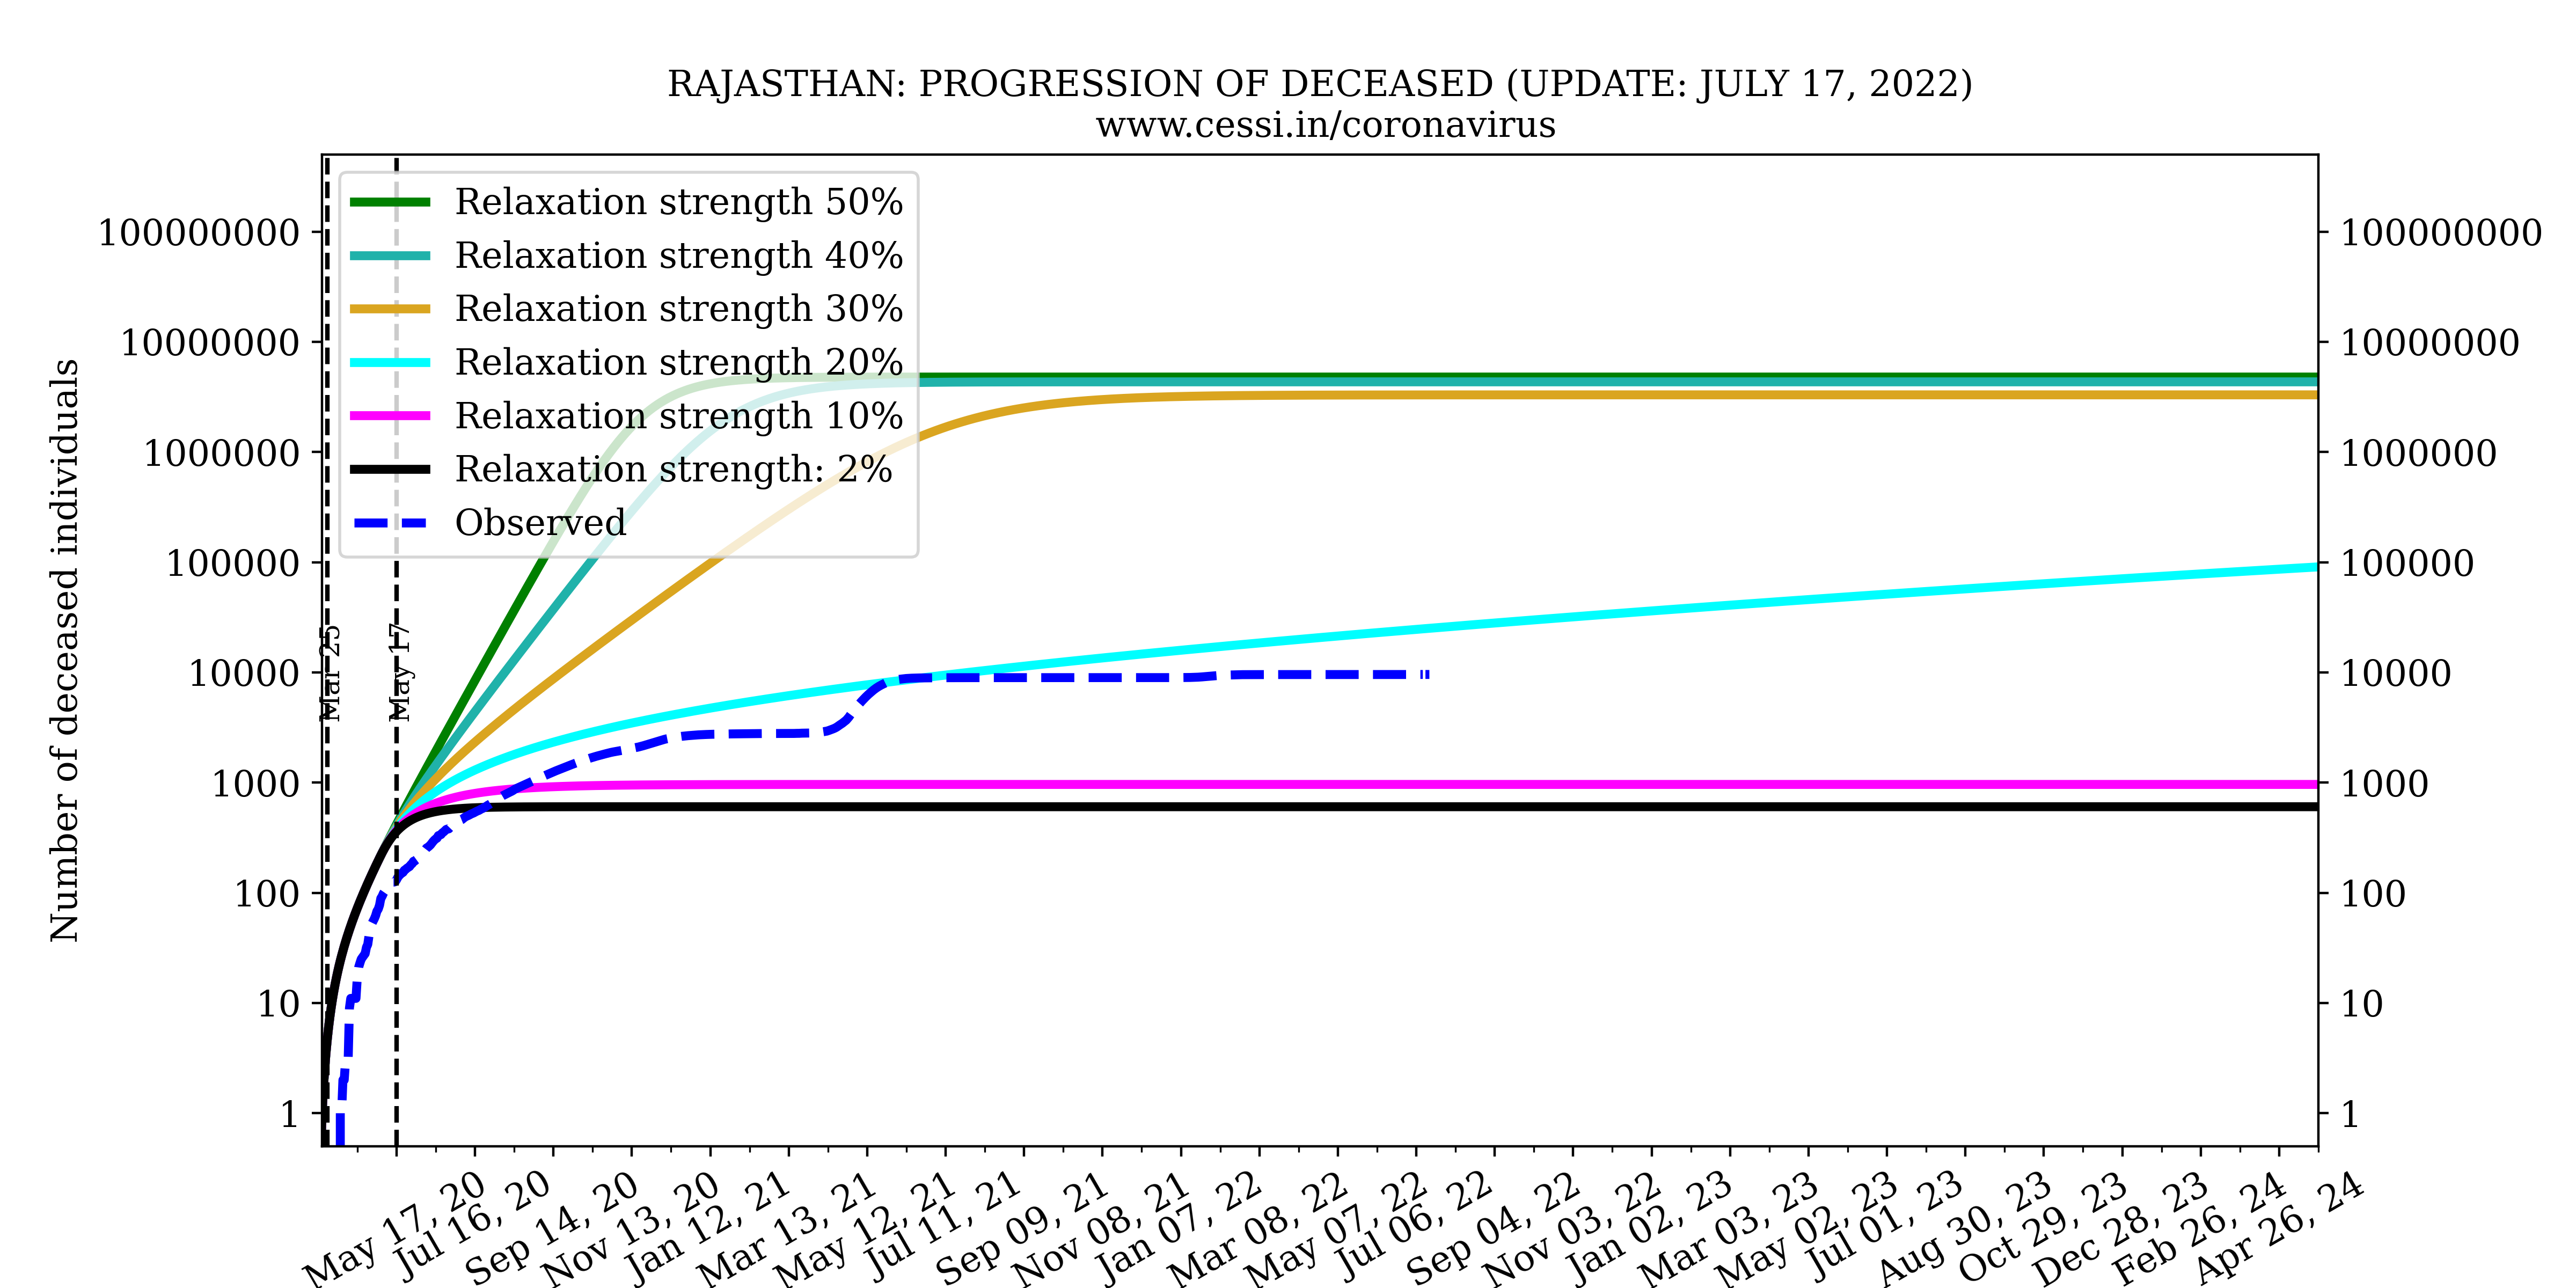
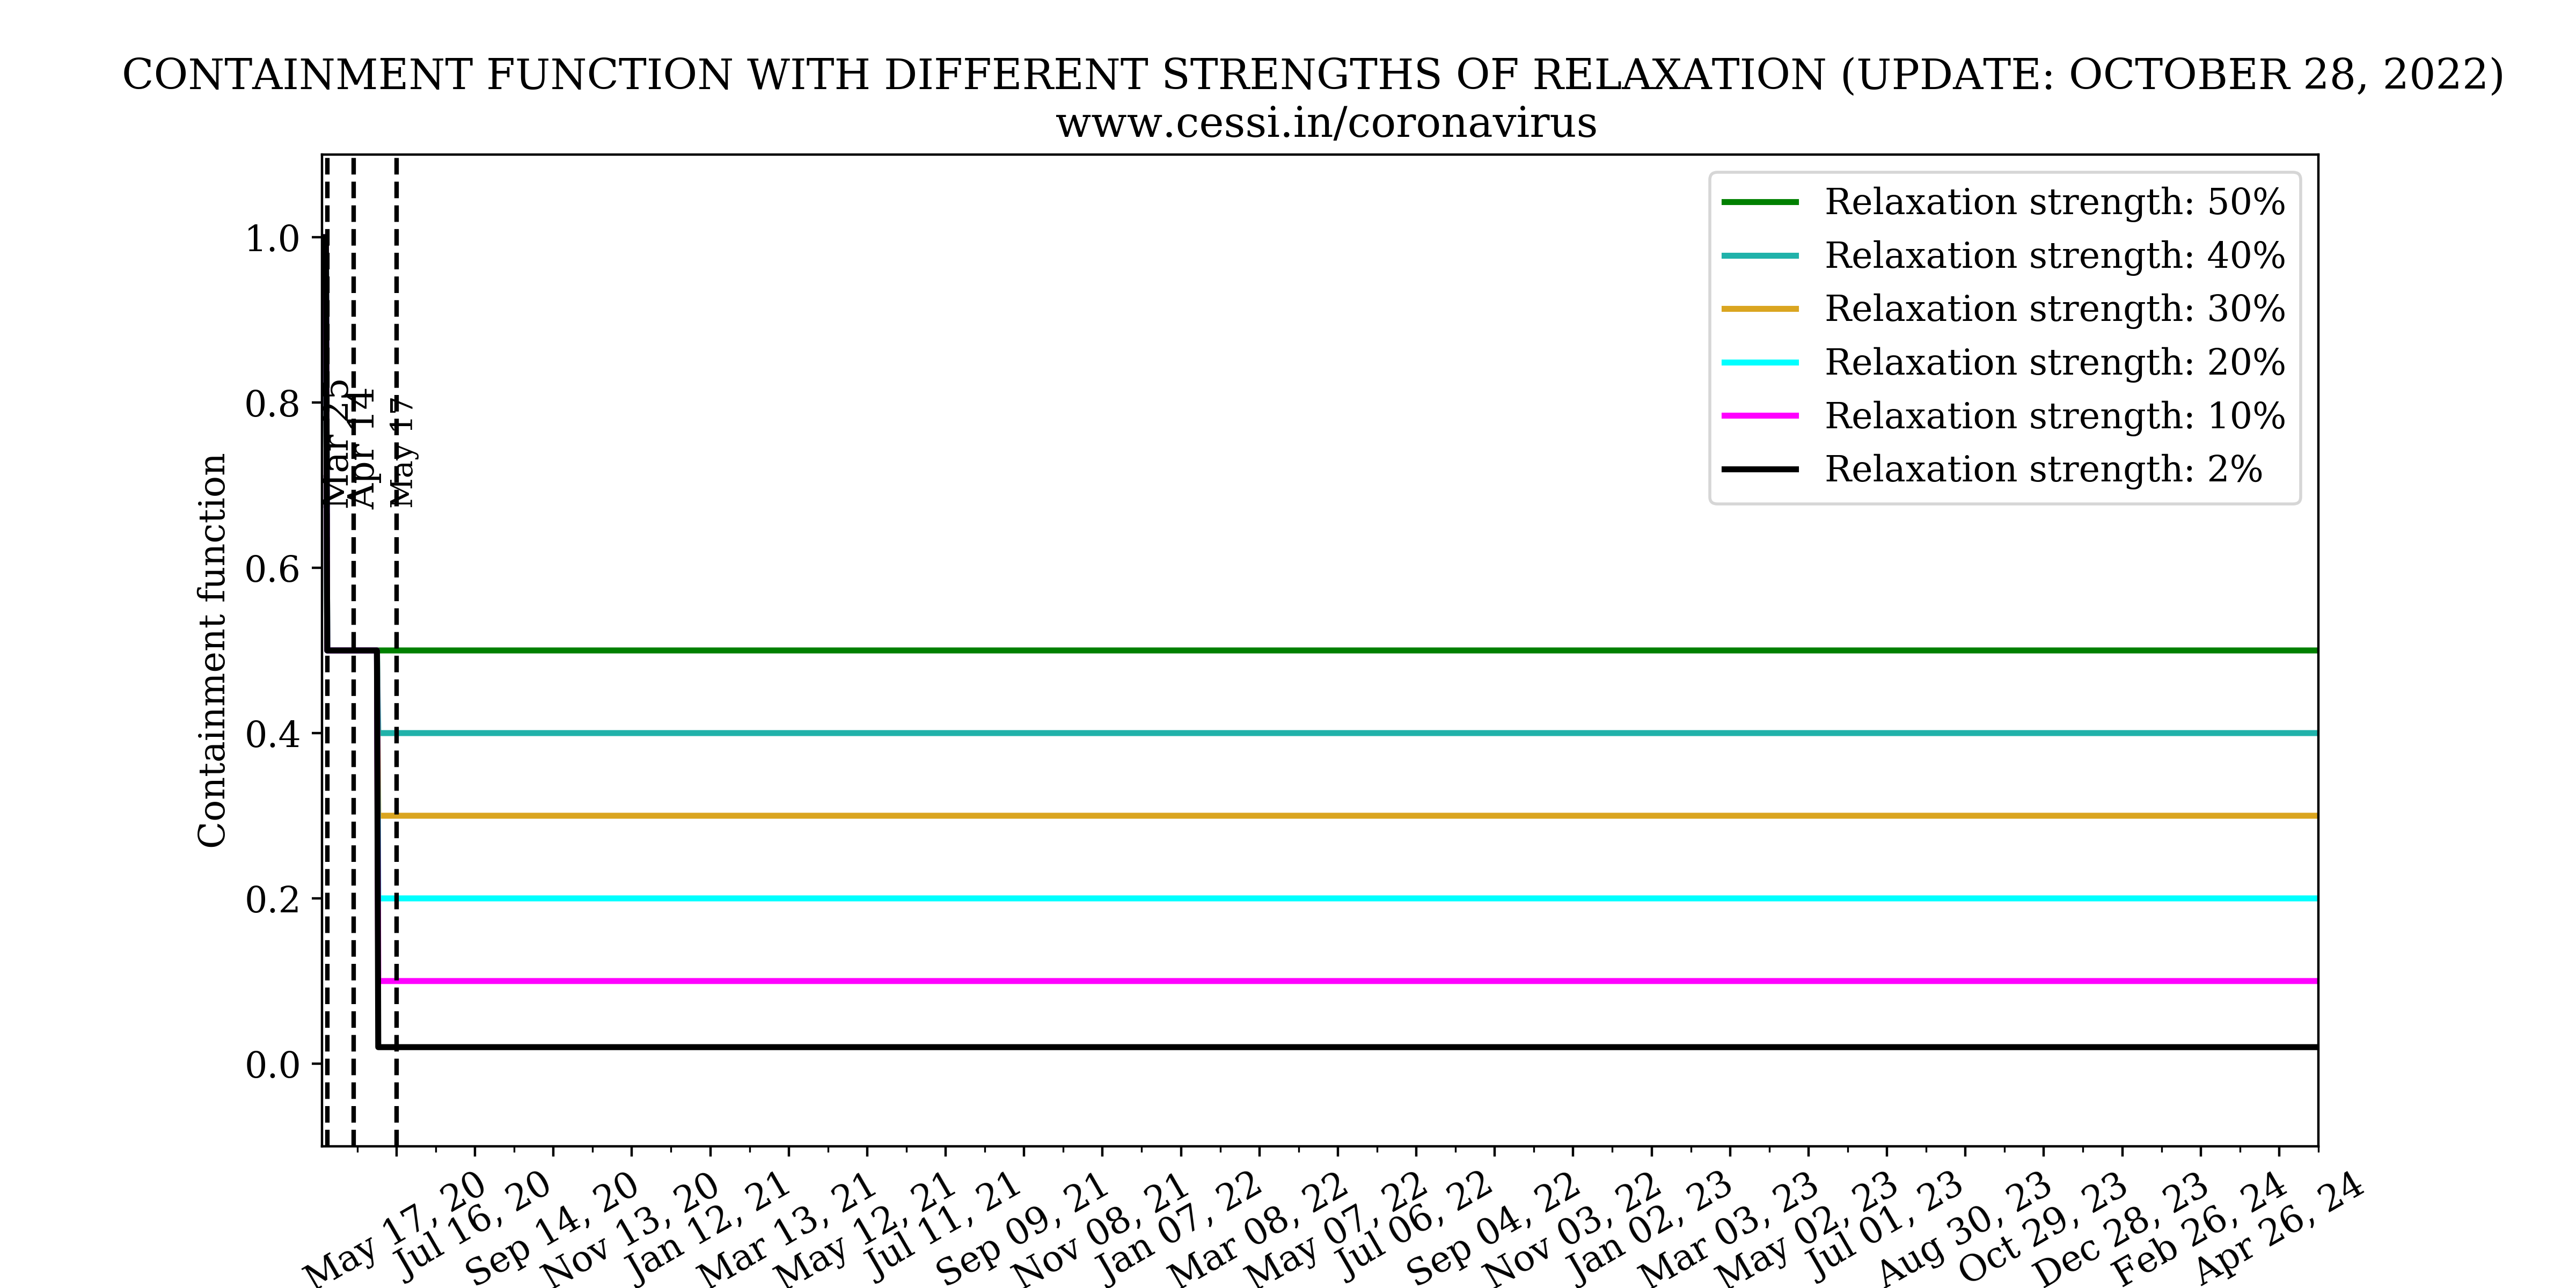
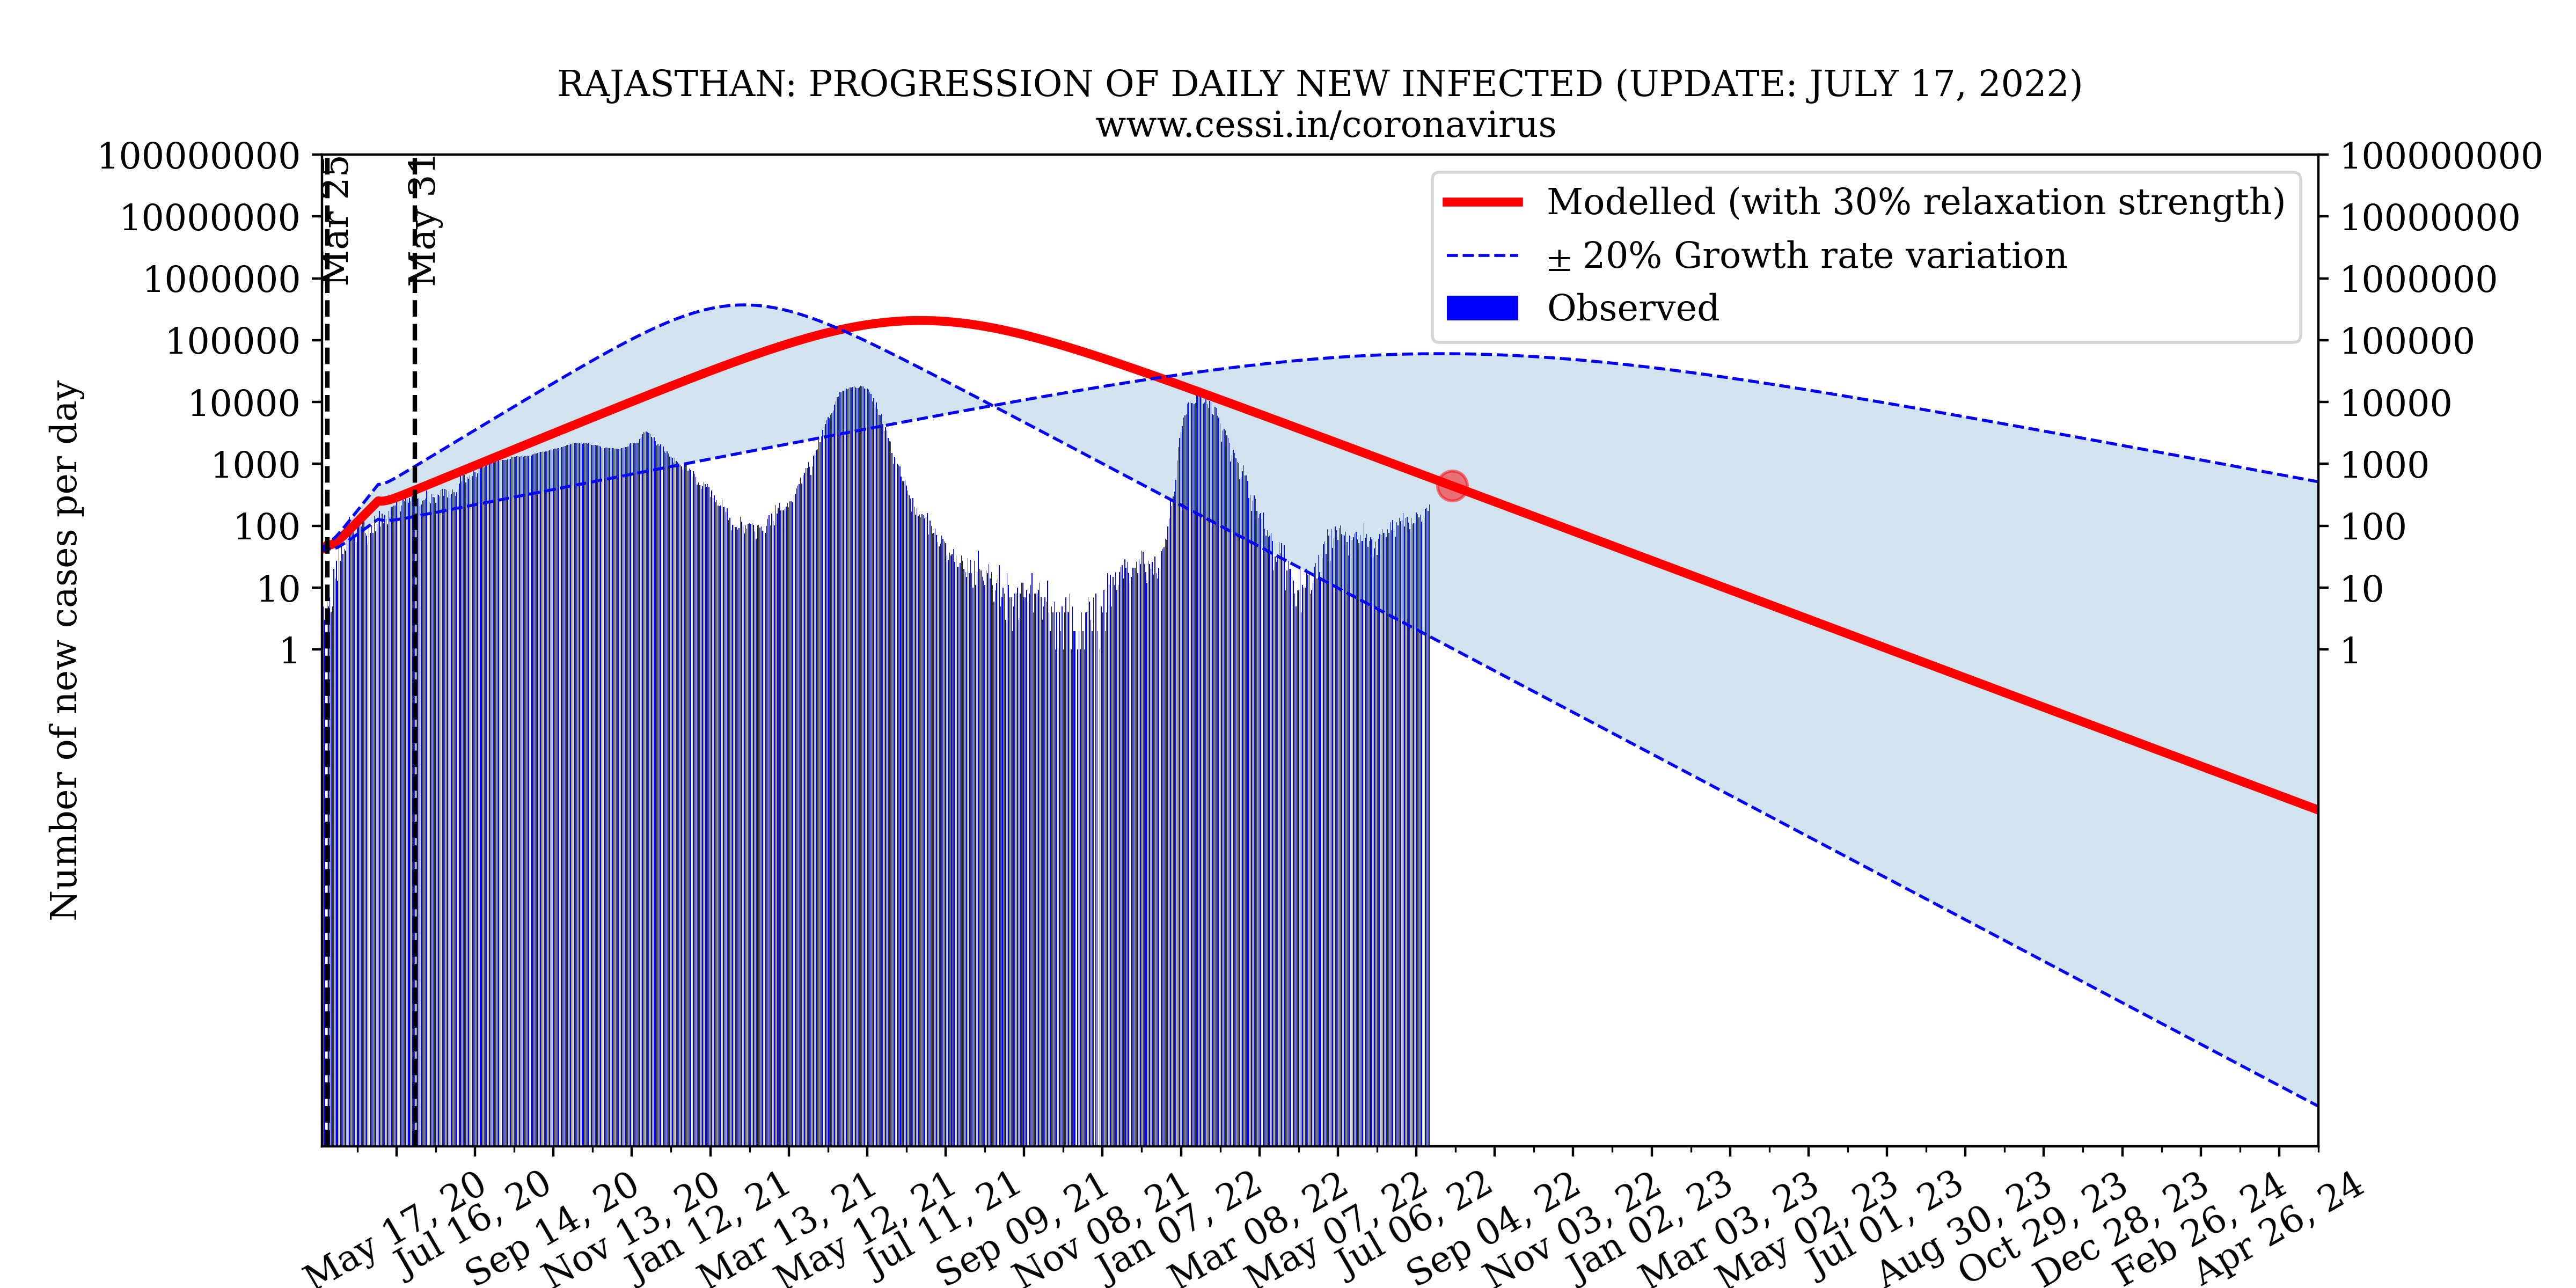
MODELLING THE COVID19 PROGRESSION FOR RAJASTHAN
These simulations are performed keeping all the values of the rates same as that for Indian context. However the initial conditions e.g. total population of the state, number of exposed, infected, recovered and deceased individuals are taken from the available observed data. Since first Indian lockdown started from 25th March 2020, the simulation starting date is choosen to be 18th March 2020 (because the data is available from 14th march onwards).
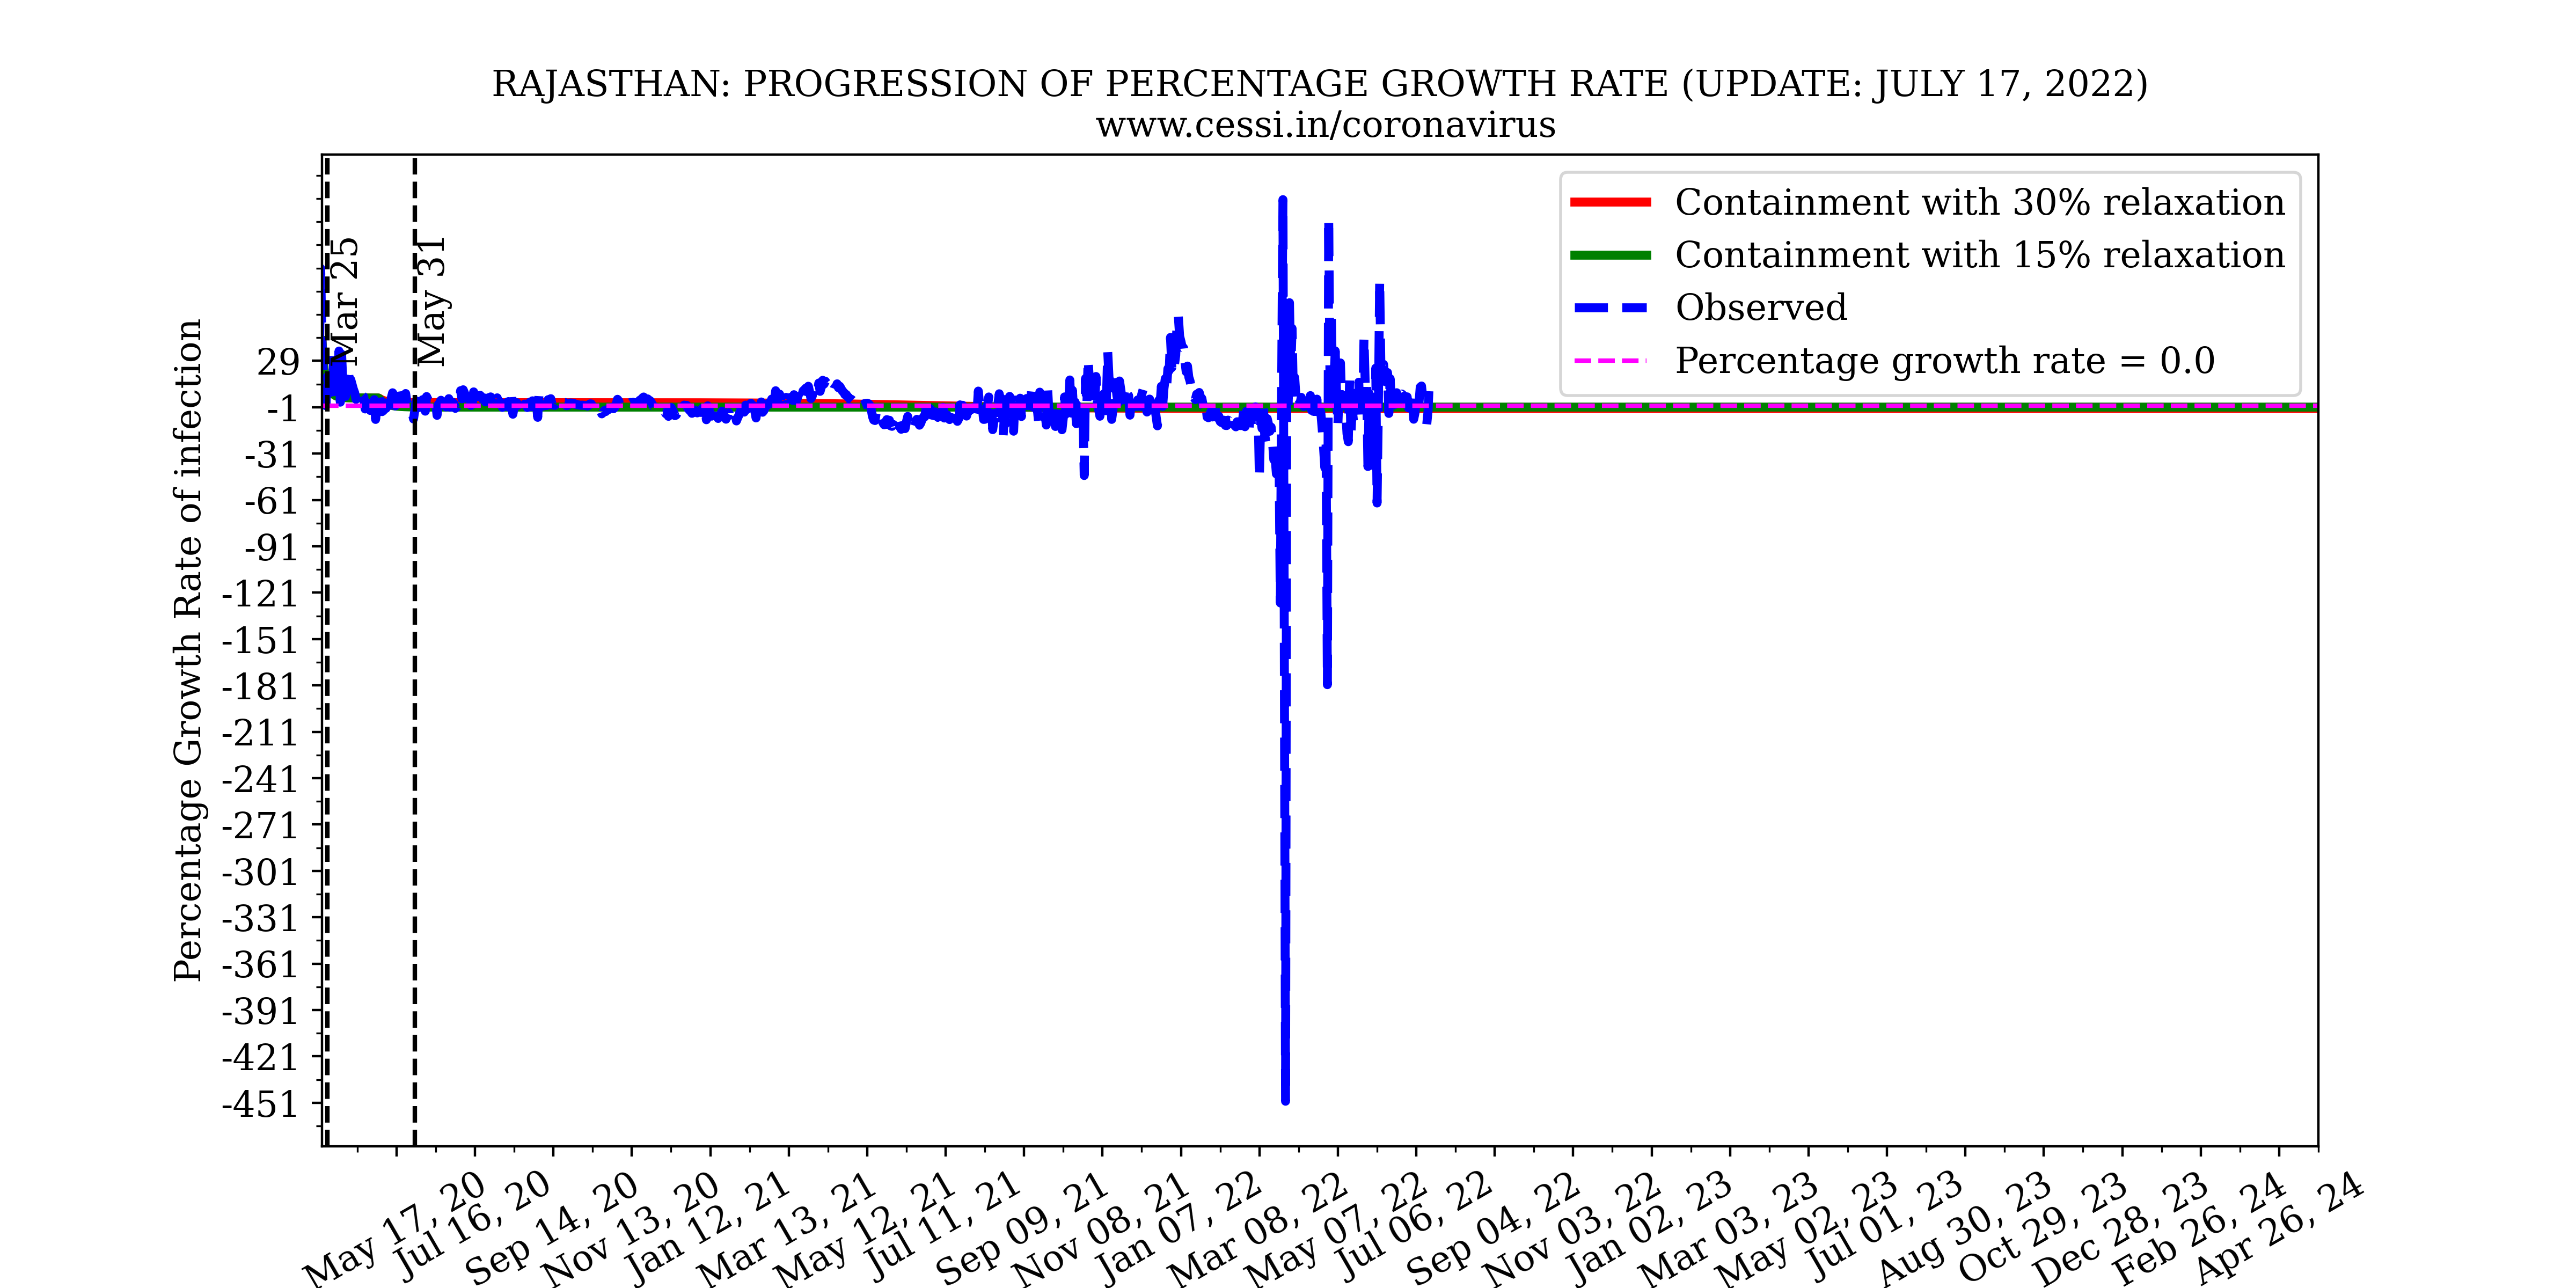
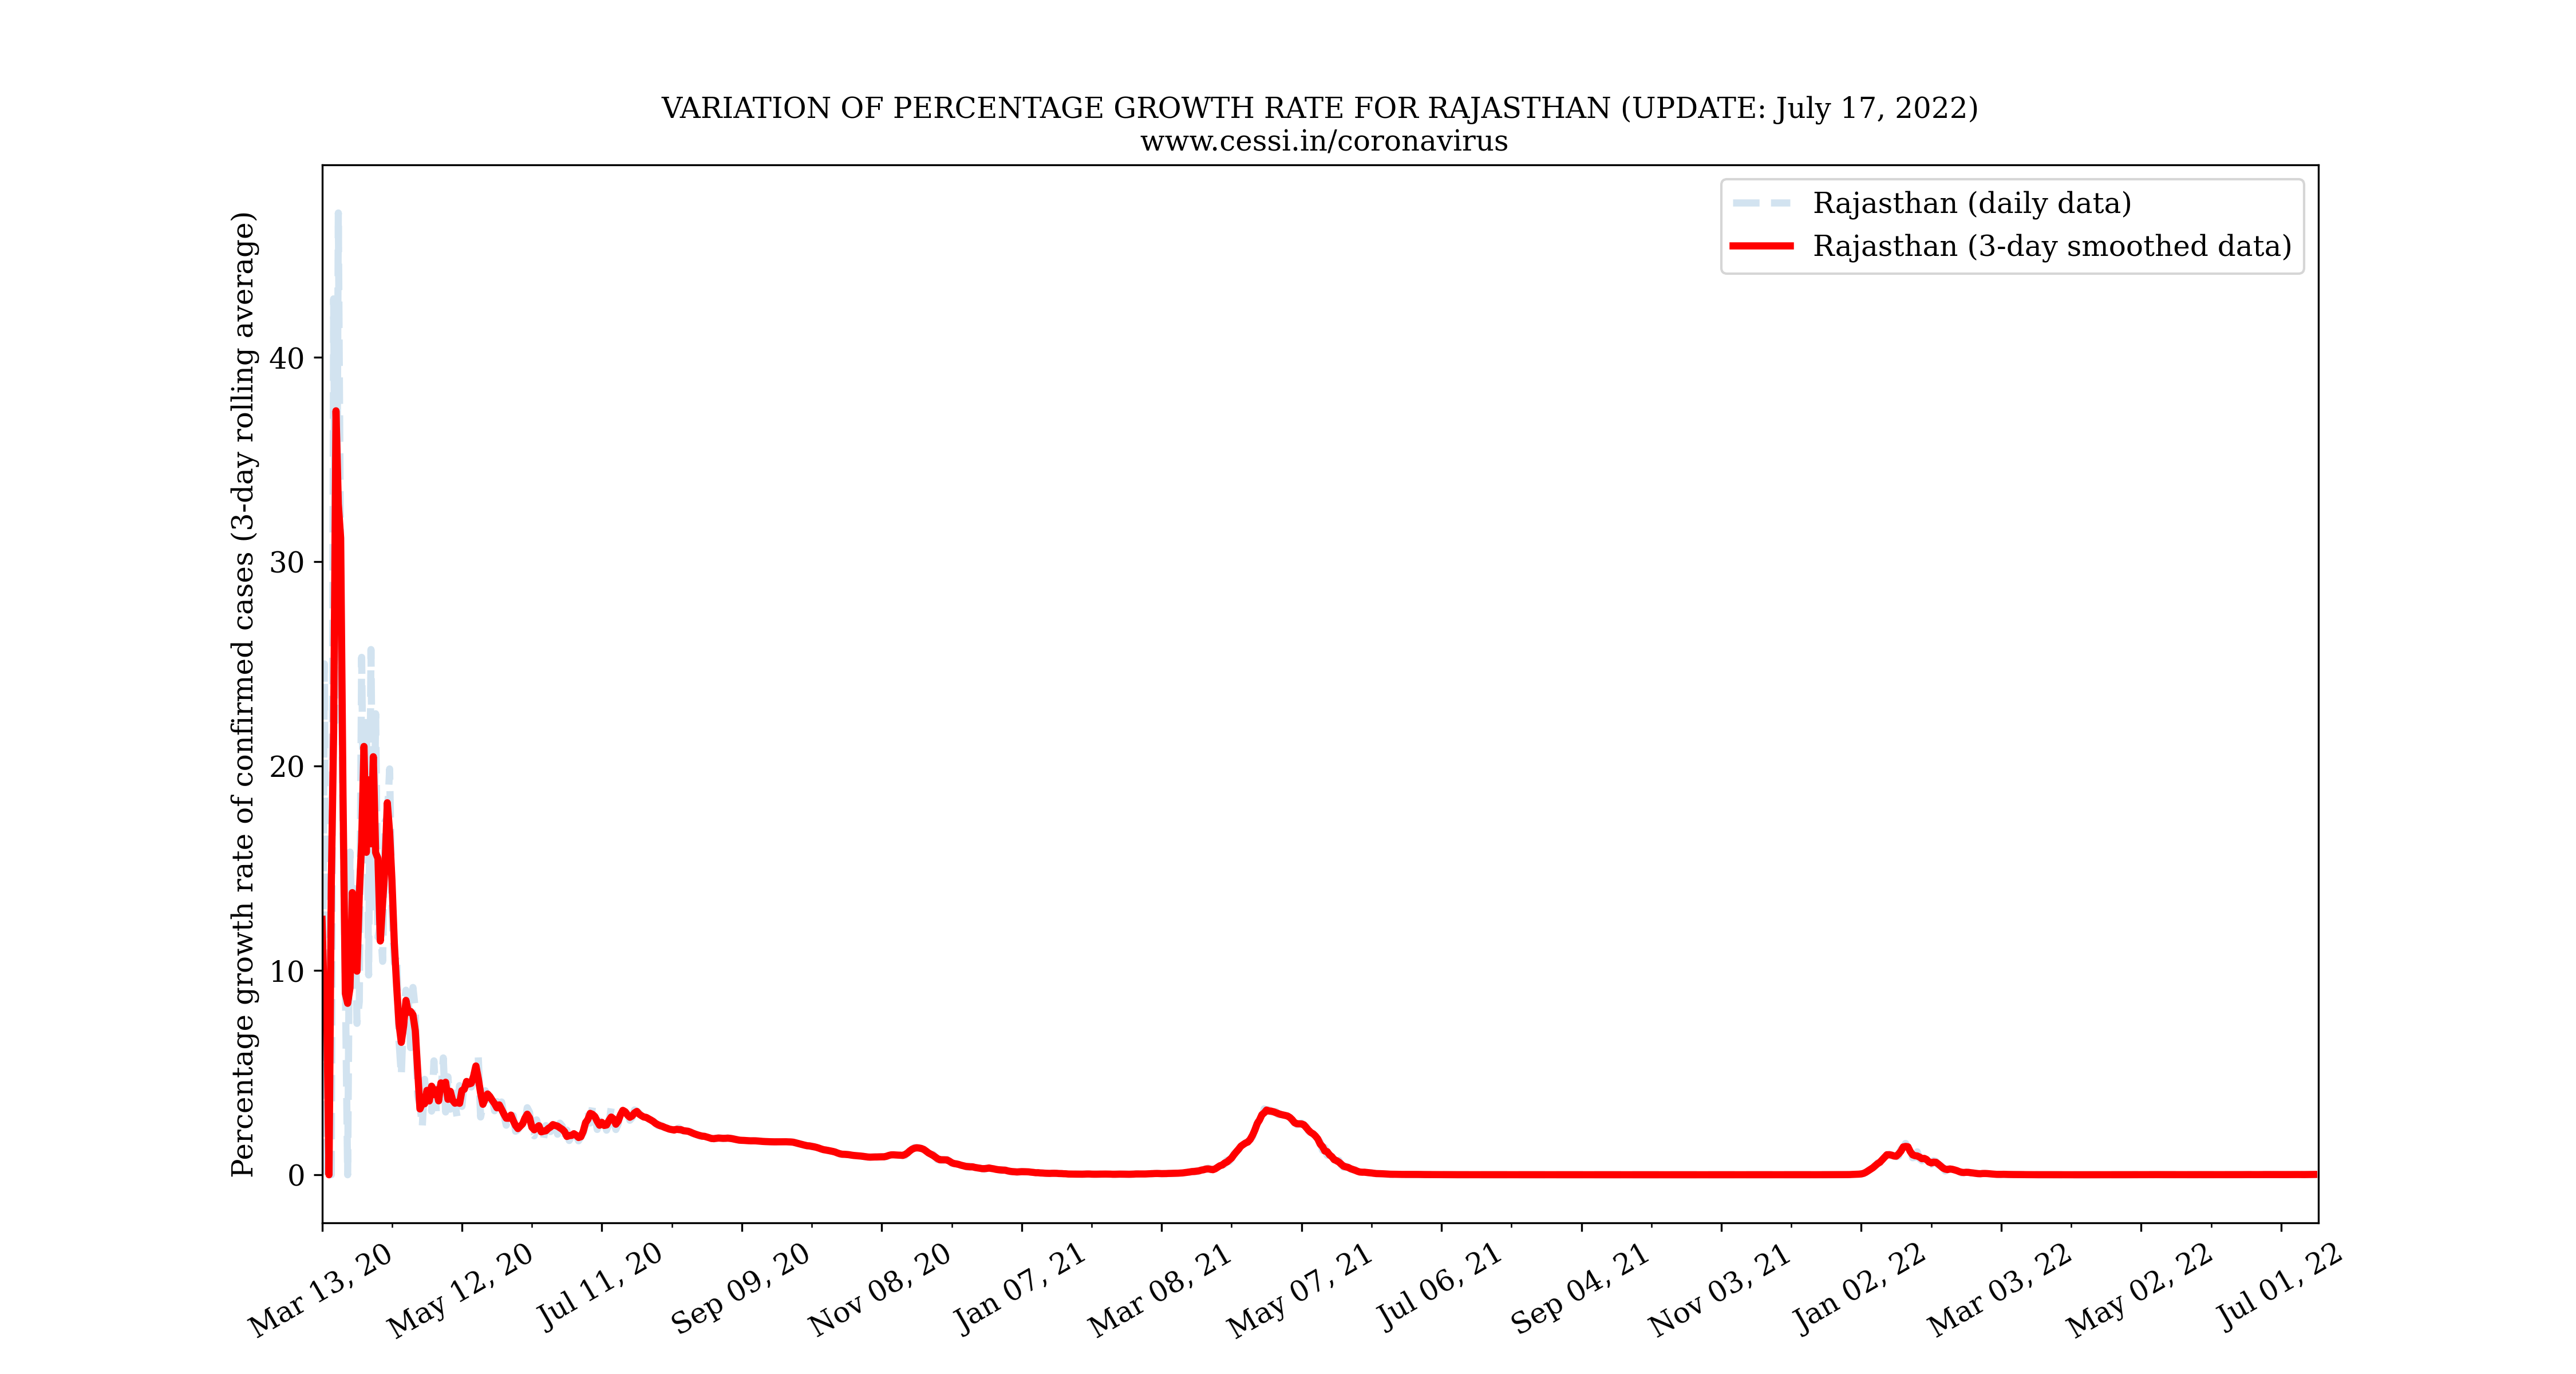
Trend in cases: percentage increase of daily growth rate
The percentage growth rate is more natural for thinking about how cases change over time. How the growth rate is calculated: 100*daily confirmed cases/total confirmed cases.
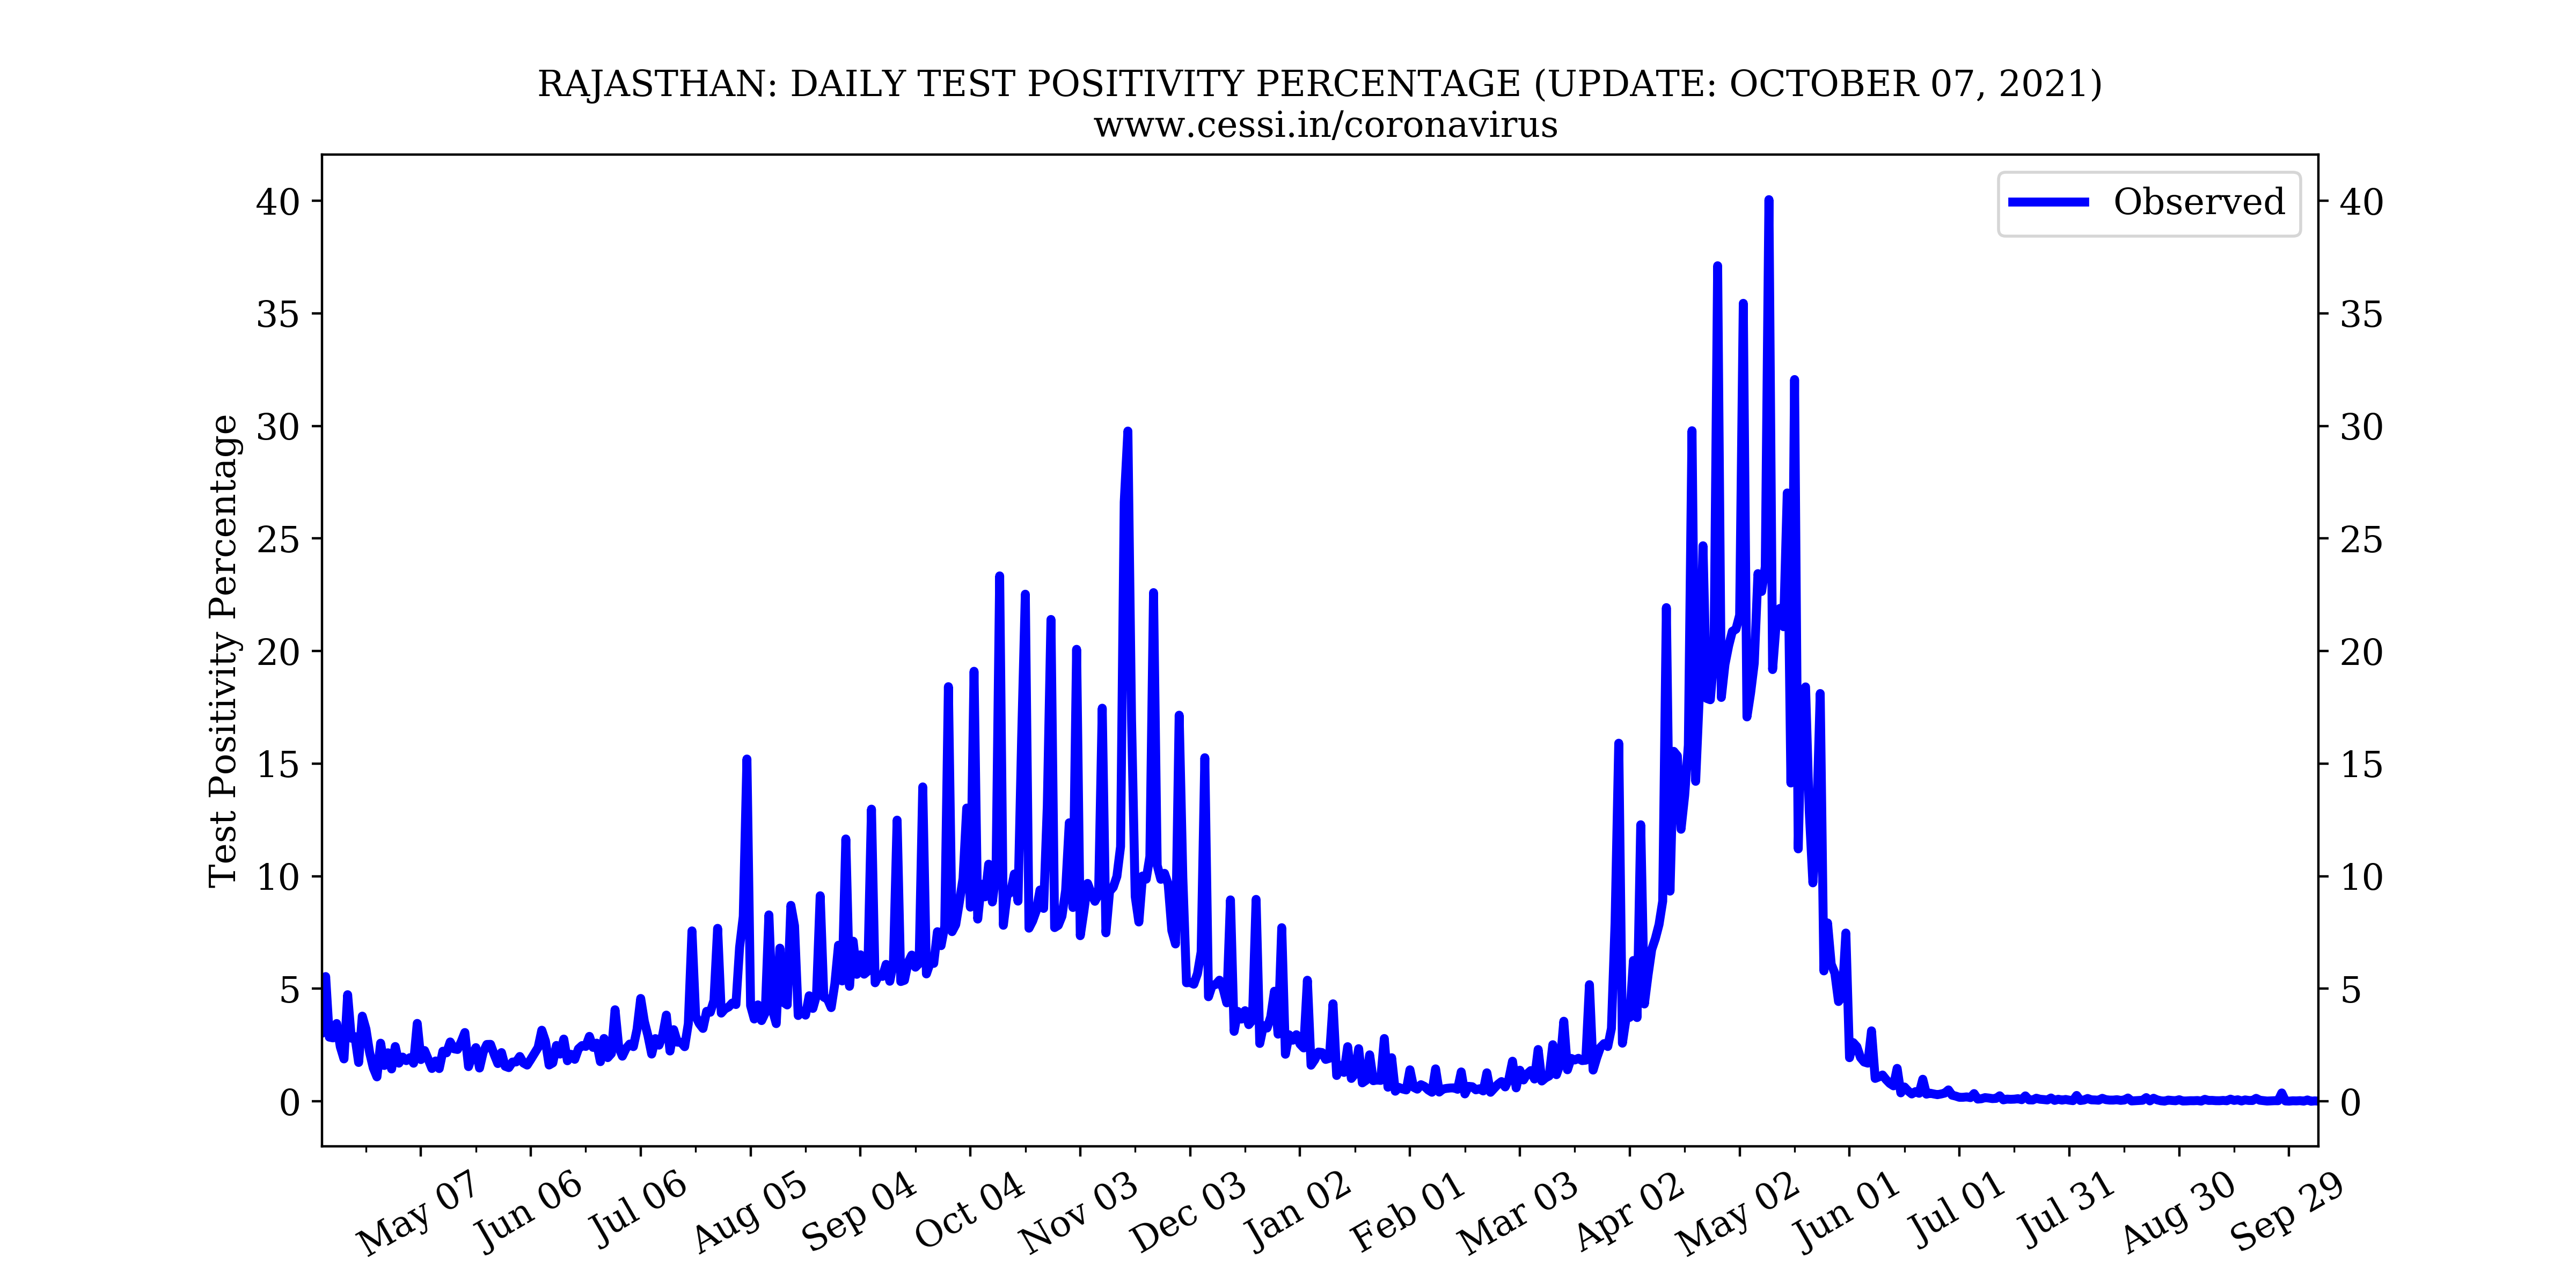
Progression of test positivity percentage
How the test positivity percentage is calculated: 100*daily confirmed/daily tested.
The assumption in this plot is that the results become immediately available on a daily basis following tests,
which may not be true.
However, the long term trends would not be affected by the validity of this assumption.
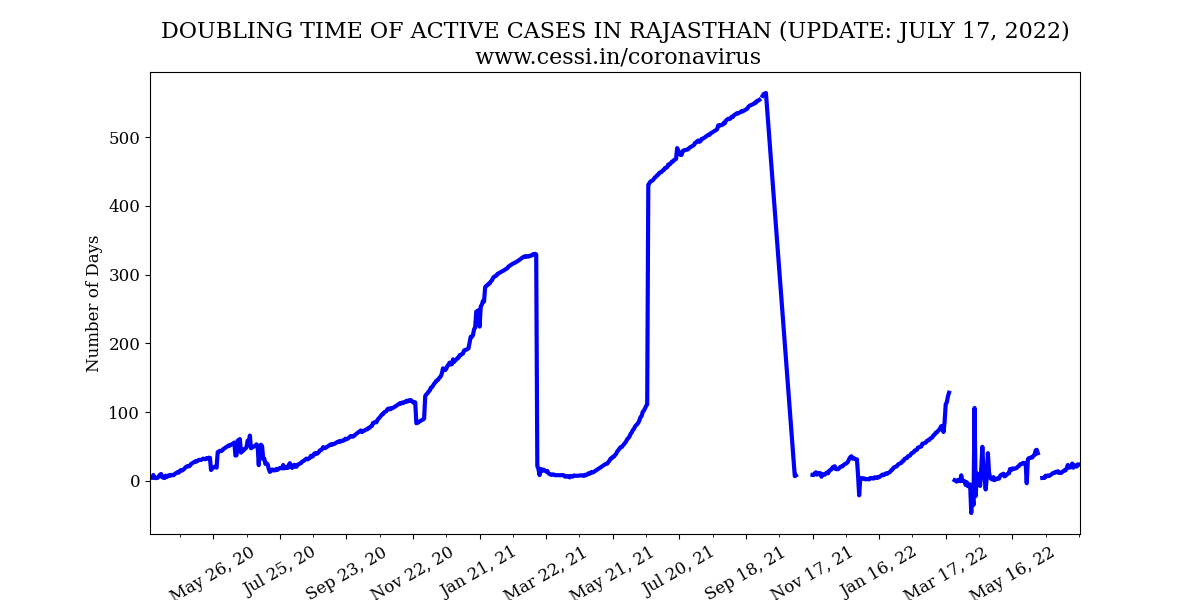
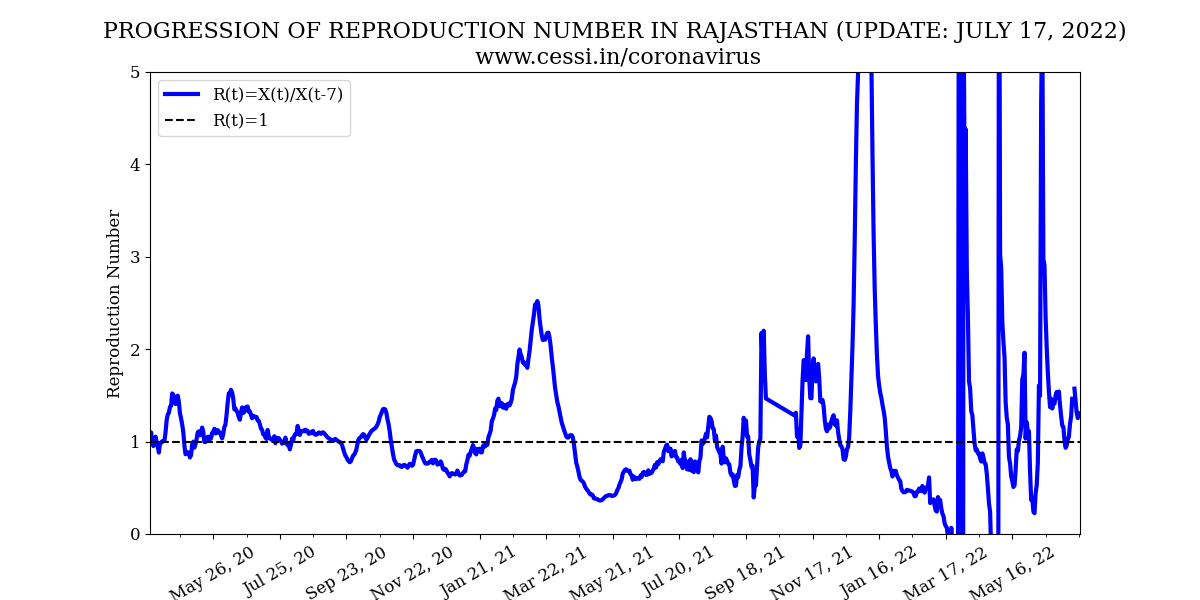
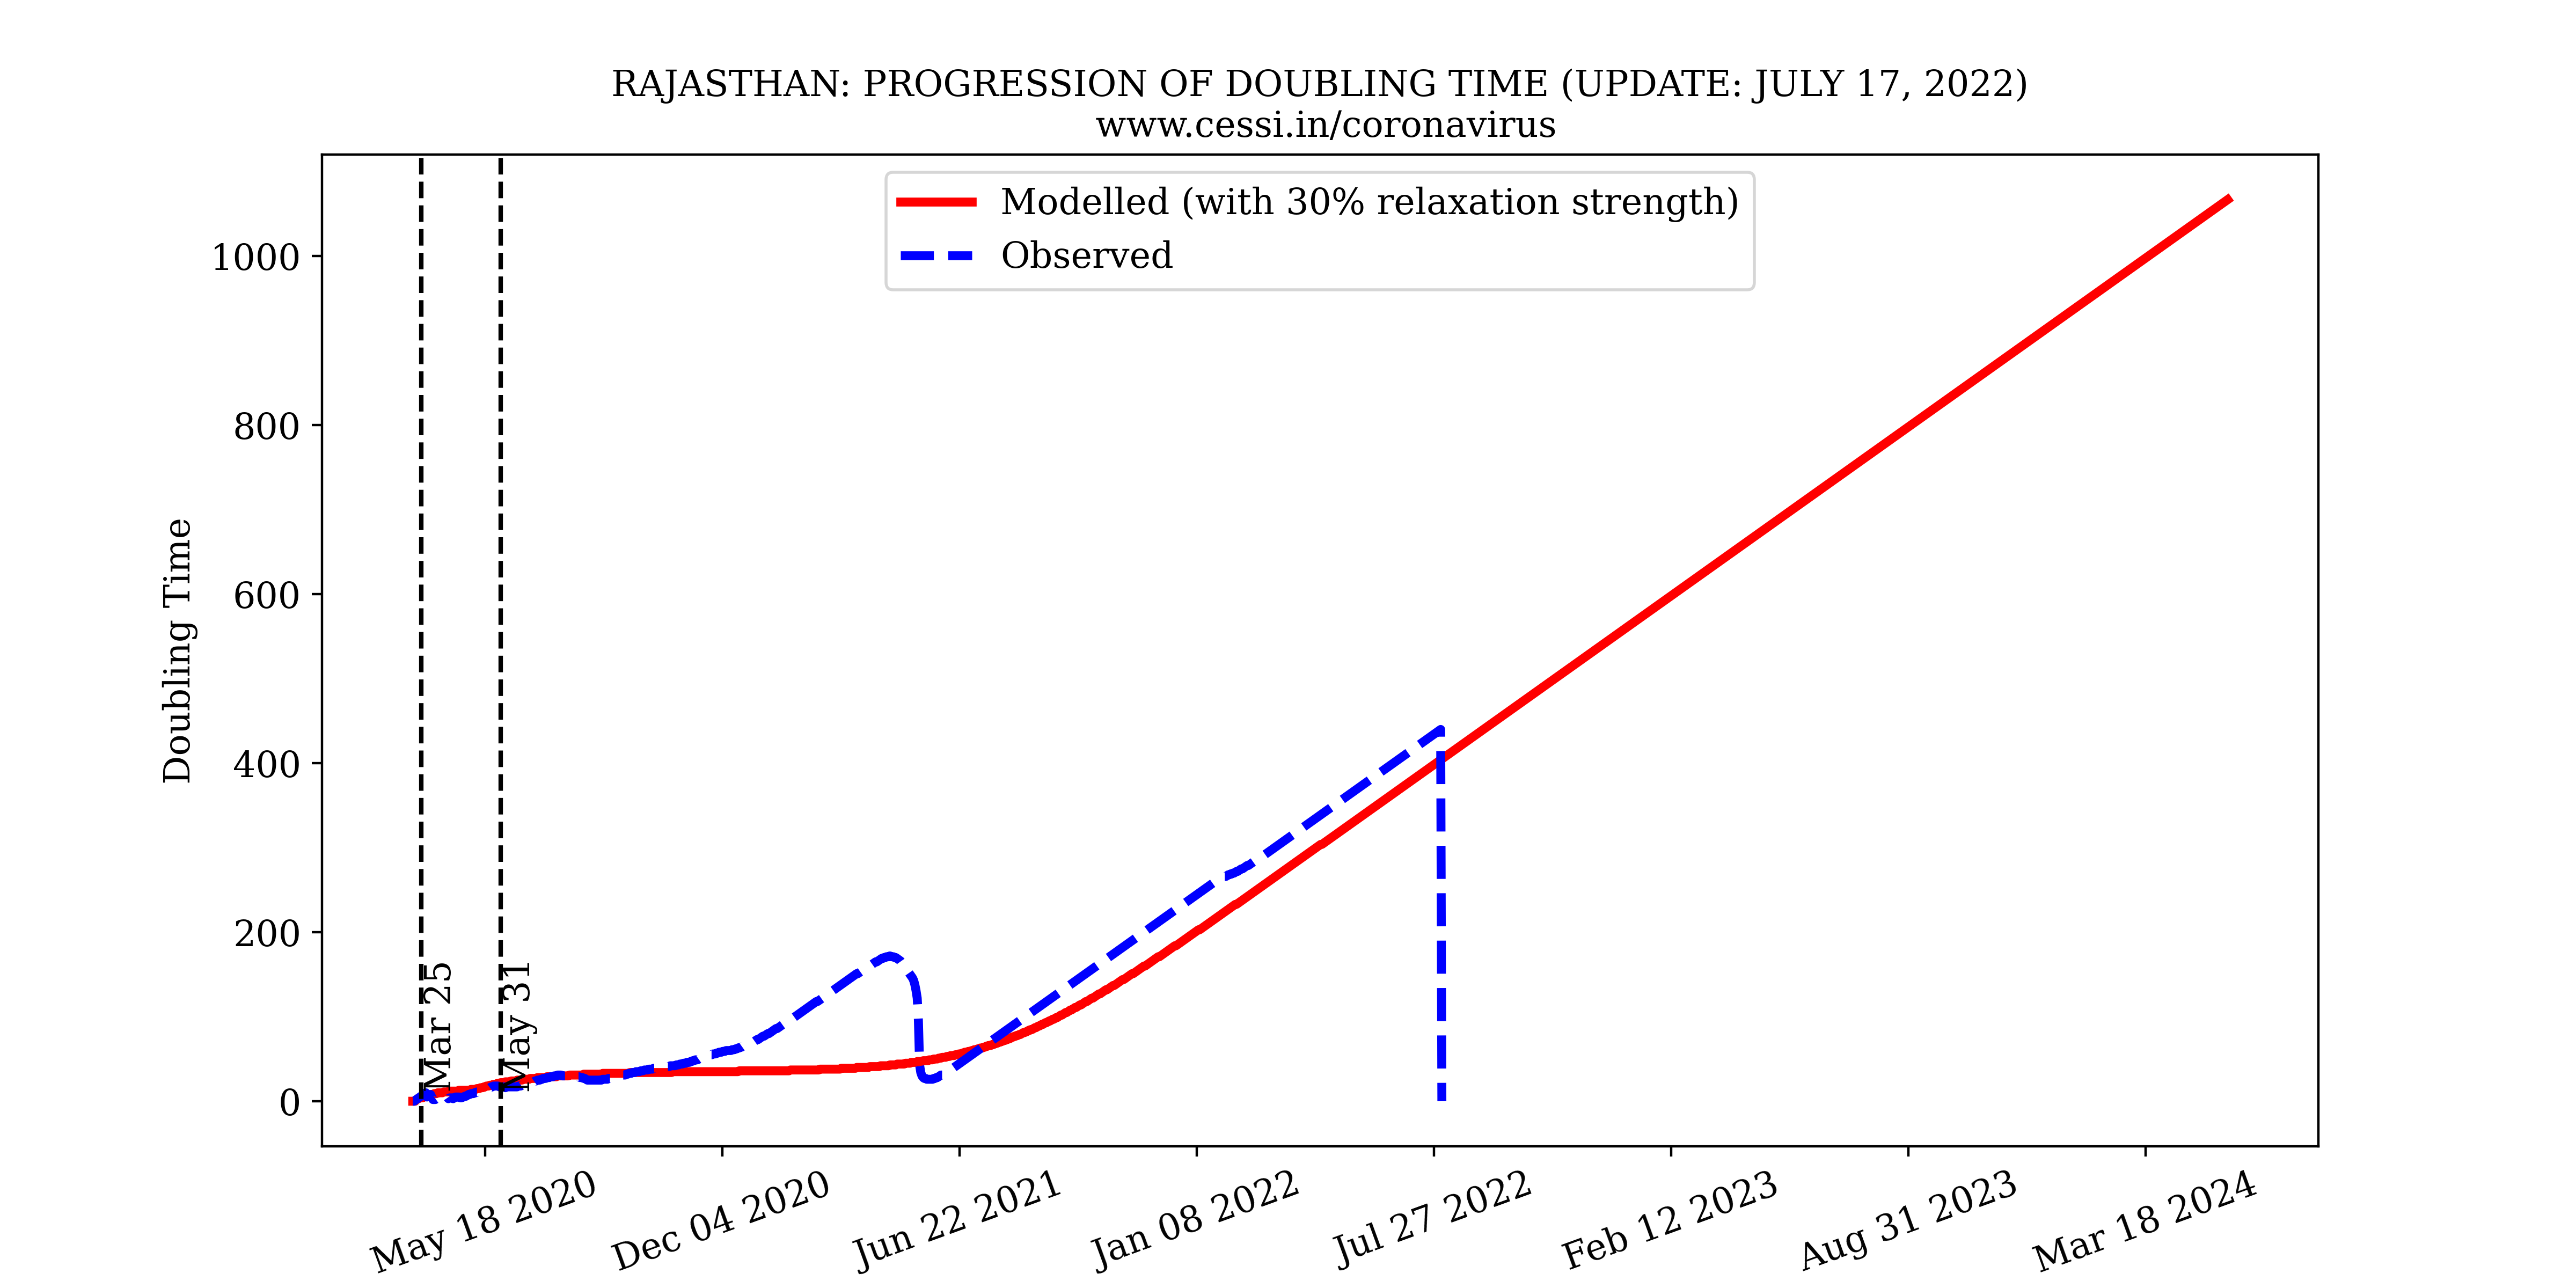
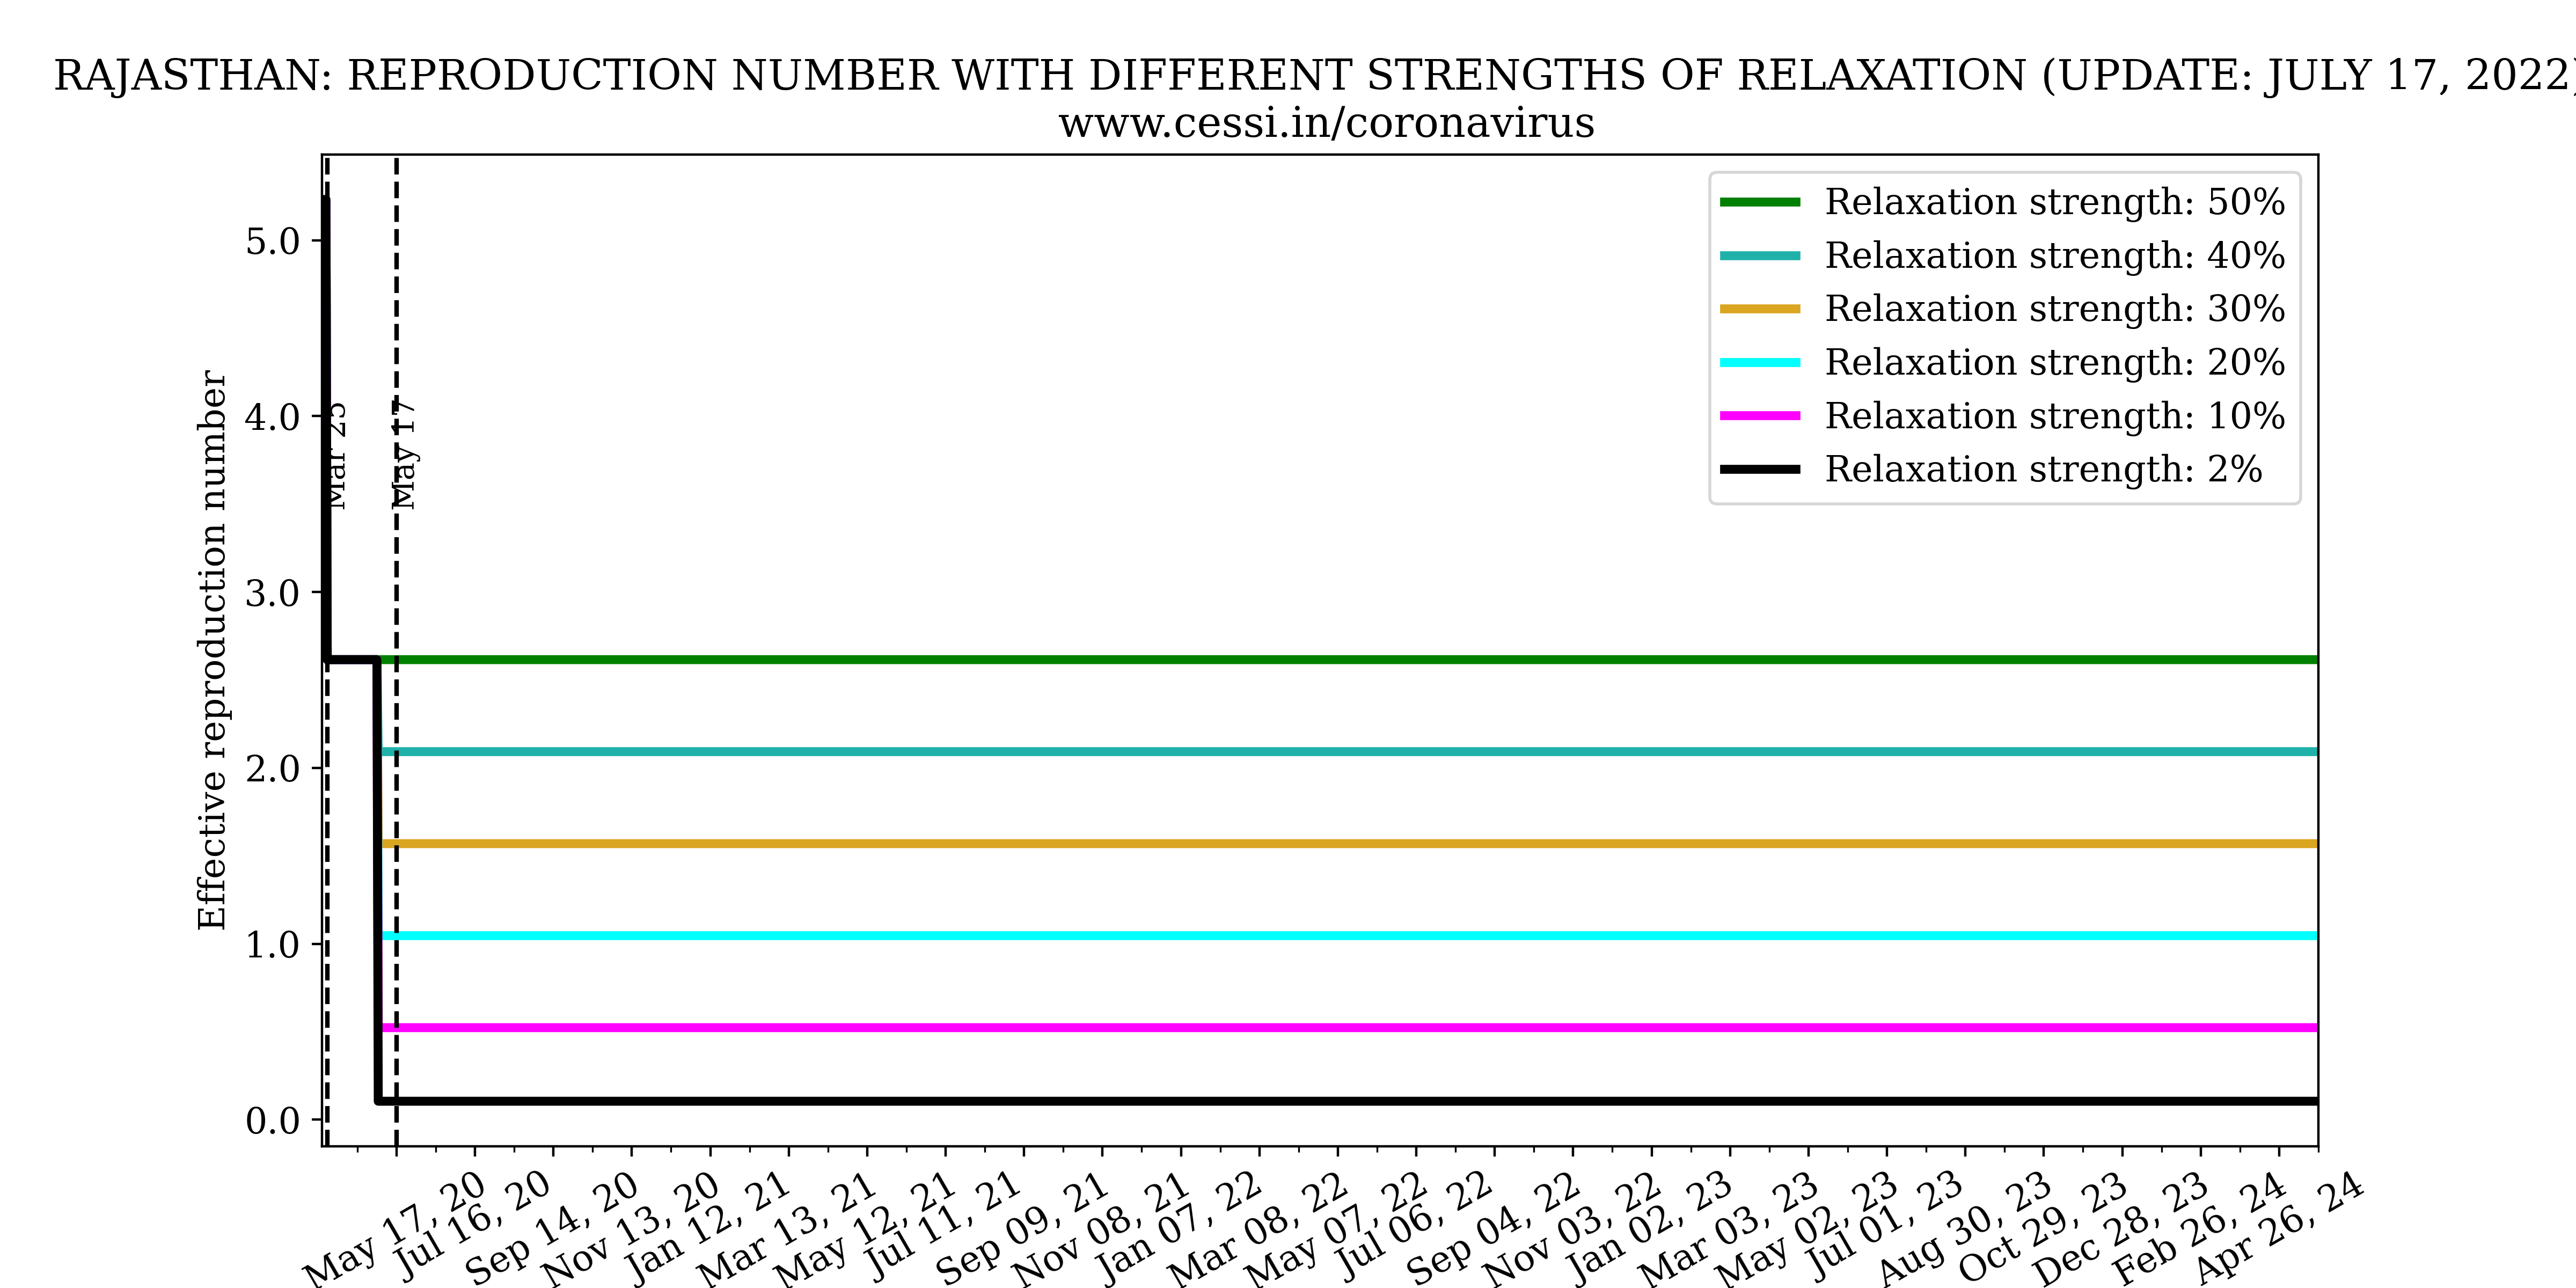
Progression of reproduction number (R) and doubling time
Doubling time is defined as the number of days required for the number of active cases to double. The plot above shows how the doubling time is changing with time in India (after the first 10 cases). The number of active cases is what remains when the number of deceased people and the number of recovered people are taken away from the number of confirmed cases. The left panel shows the doubling time. A higher doubling is desirable since this would mean that the spread of the disease is slowing down. It is apparent from the plot that the doubling time has been increasing since the lockdown was implemented.
On the right panel, we plot the Reproduction number versus time. Reproduction number R is the number of people infected by a single infected person. A Reproduction number below 1 is desirable to slow the spread of the virus. This is how we estimate the reproduction number.
Let X(t) be the number of active infections at time (t), where t is a particular day. Then, the number of people infected by X(t) is given by R(t)X(t). For example, if R(t) = 1, then X(t) will infect another X(t). Assuming that it takes 7 days for symptoms to manifest,
R(t) = X(t+7)/X(t). This can equivalently be described by R(t) = X(t)/X(t-7). This is plotted in blue.