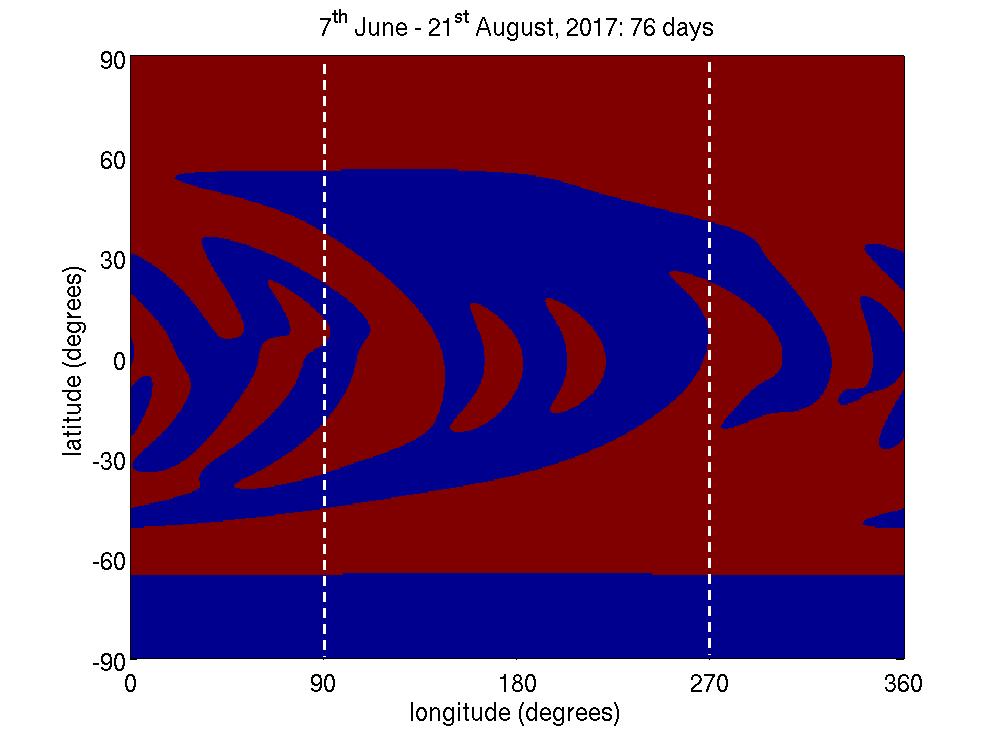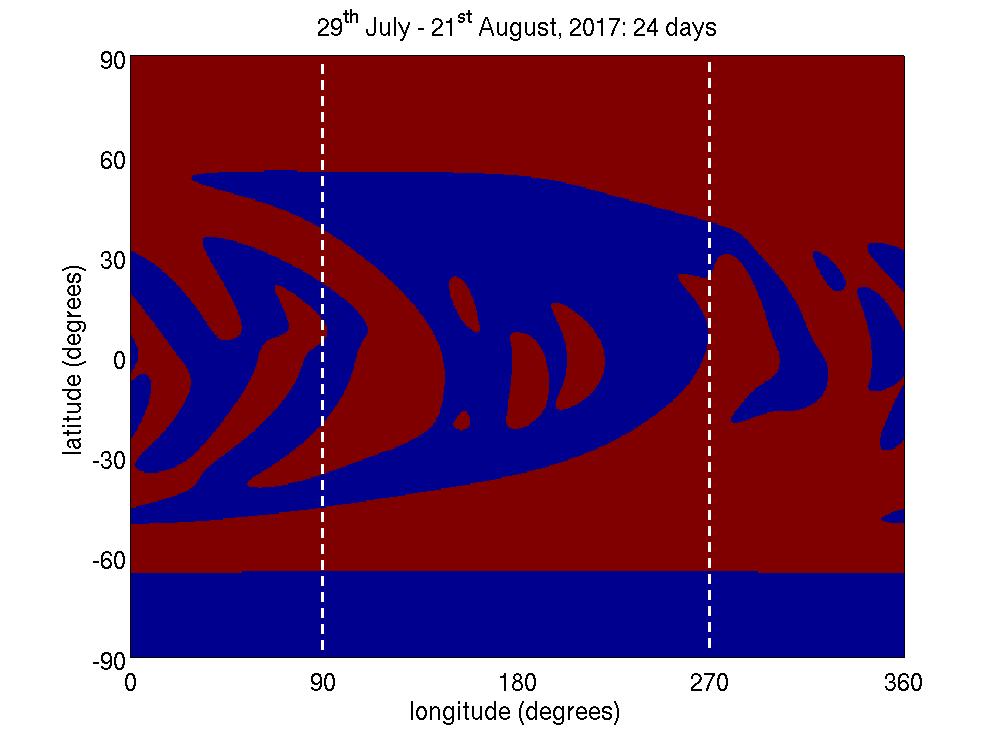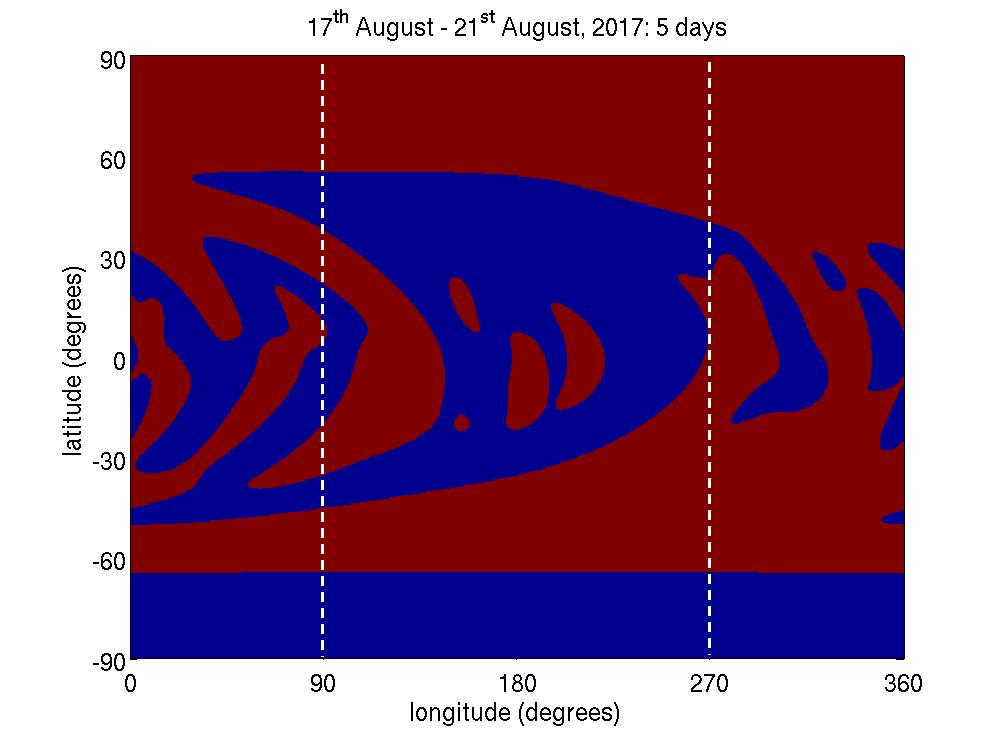
Simulations of solar surface magnetic field (saturated to clearly distinguish the polarity distribution, Red: positive, Blue: negative) indicate the locations of large-scale neutral lines which may host filaments. It is our premise that the dynamic memory of this large-scale surface flux distribution generates long-lived streamer structures (large-scale closed loops) in the corona. The two dashed lines indicate the longitude of the Sun's West (right) and East (left) limbs.
In the earlier plots rendered with the PFSS (Potential Field Source Surface) extrapolation, the surface radial field input was inadvertently multiplied with a sin(theta) factor. This update corrects for this. Note that all the originally predicted structures remain the same, but their locations match the observed structures more accurately after this correction.
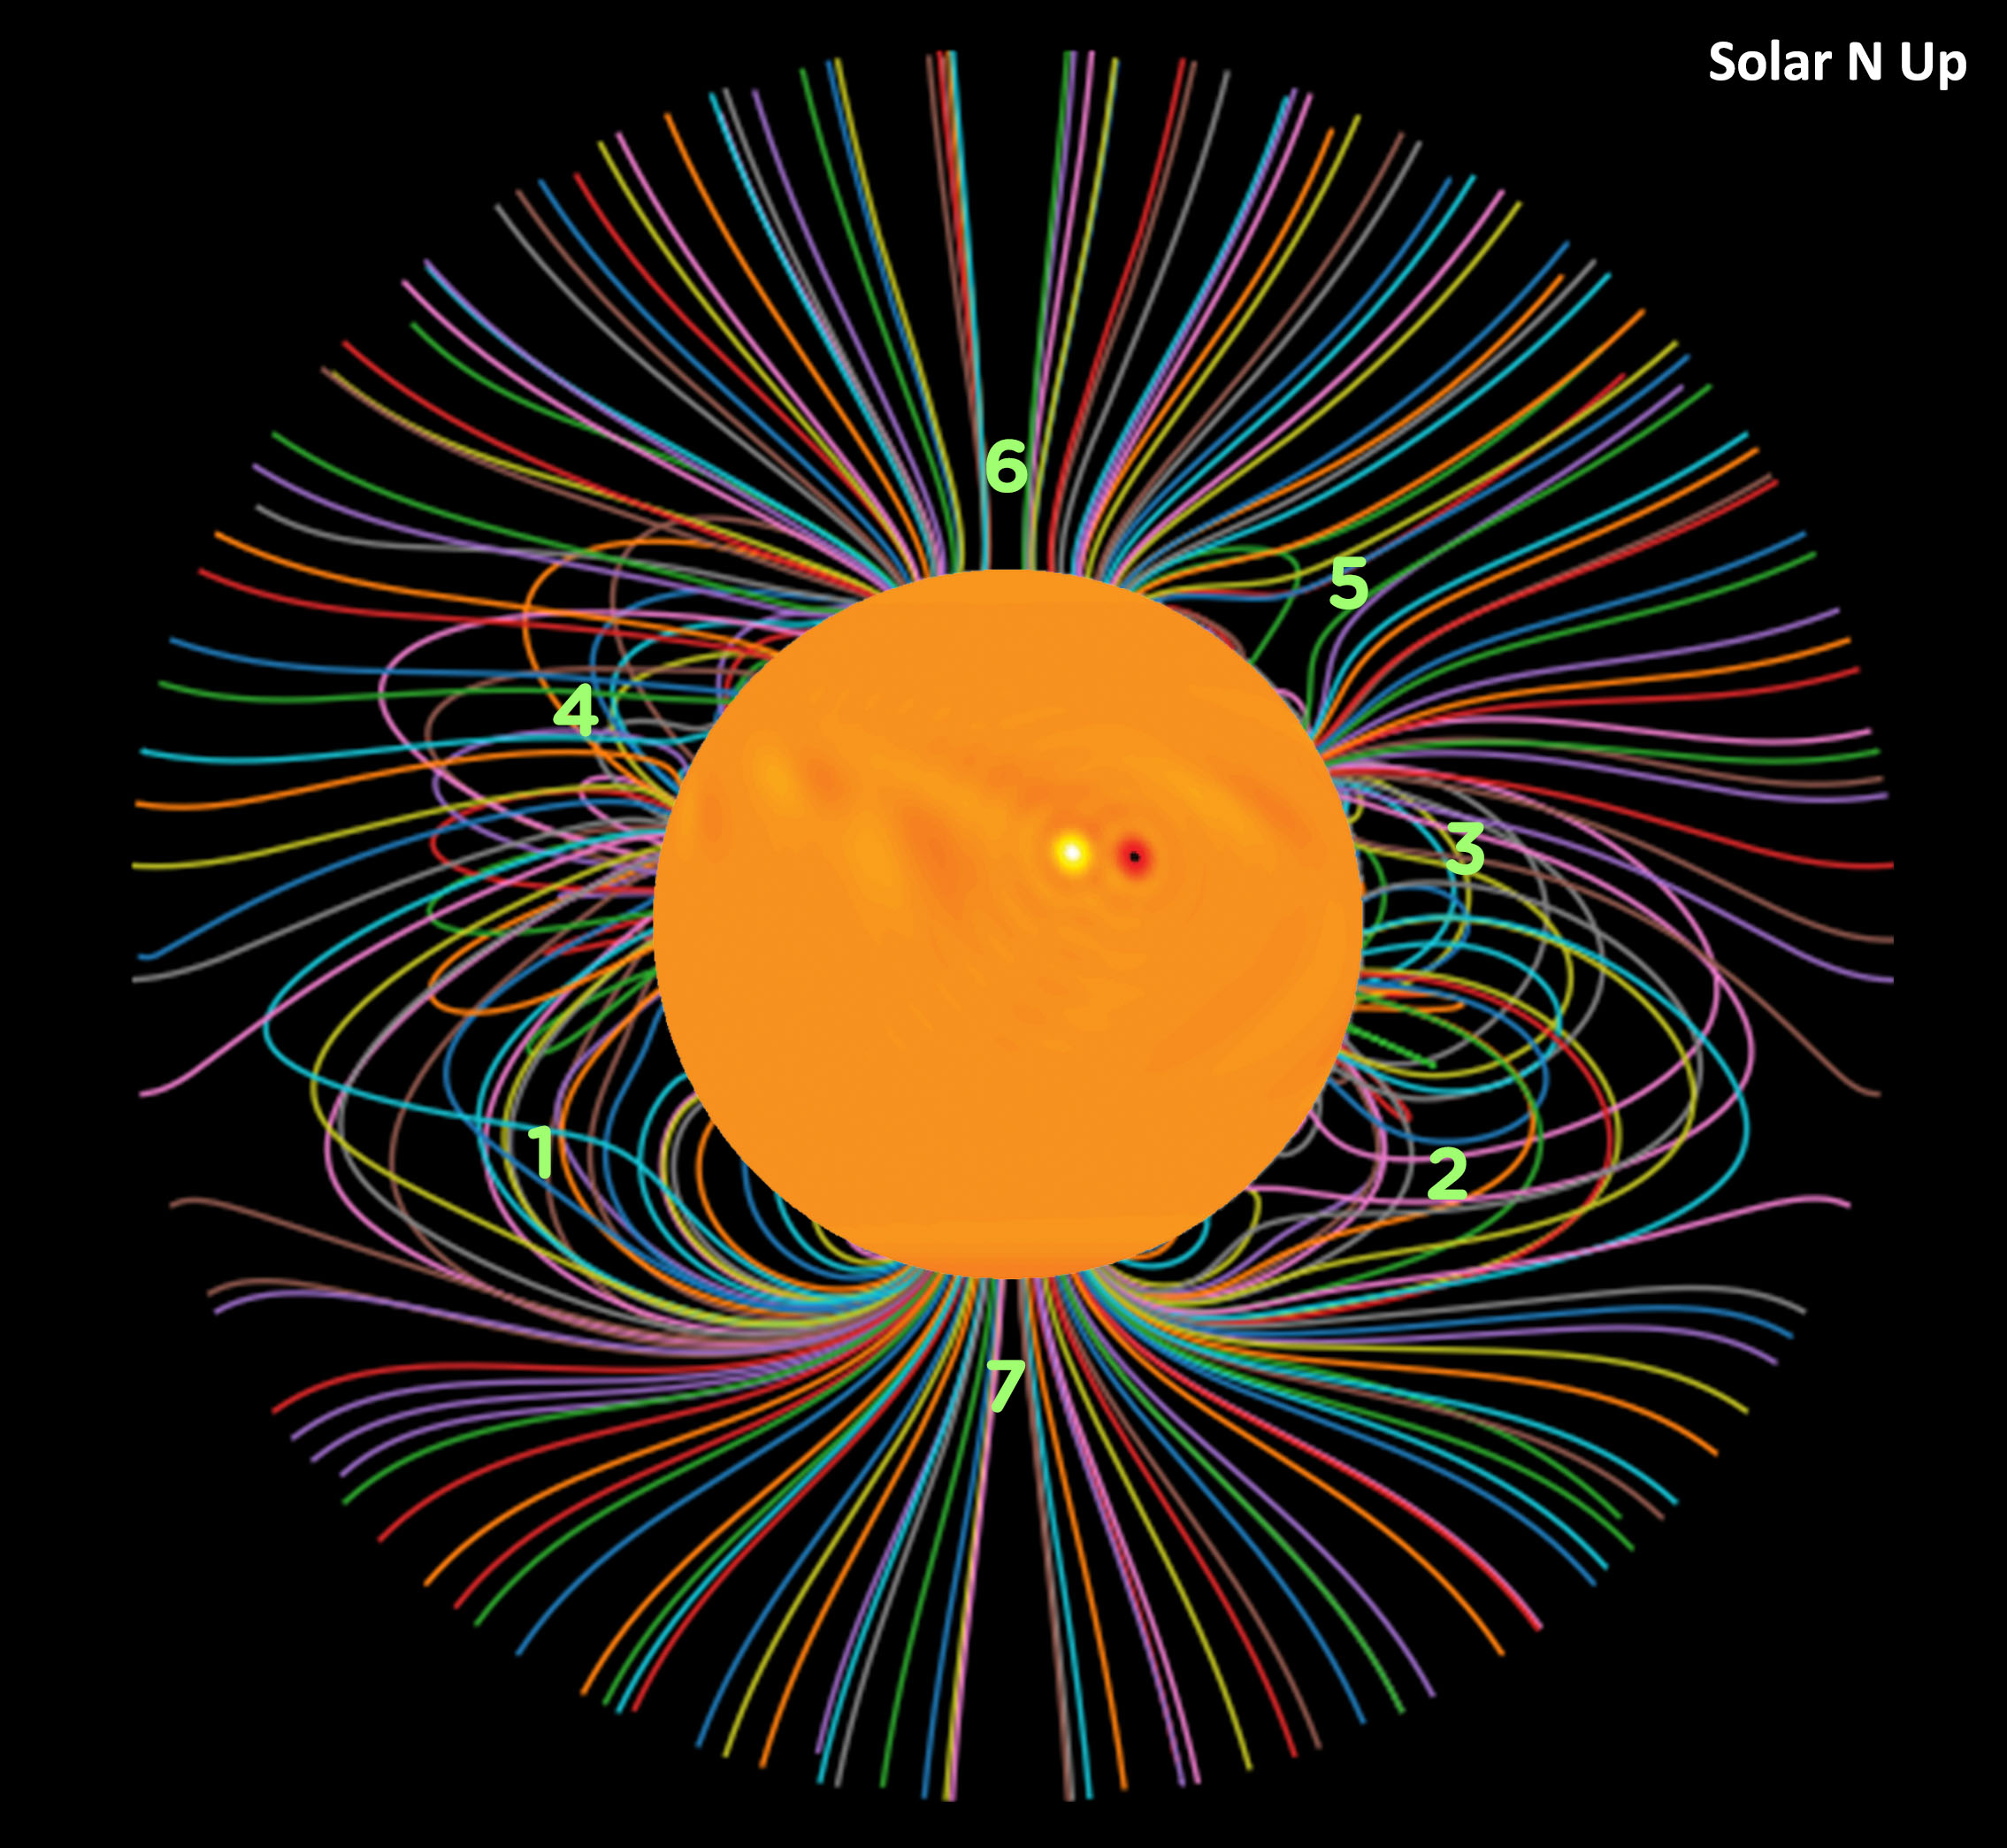
Updated Figure II(a) Center Inlay: Simulated surface field |
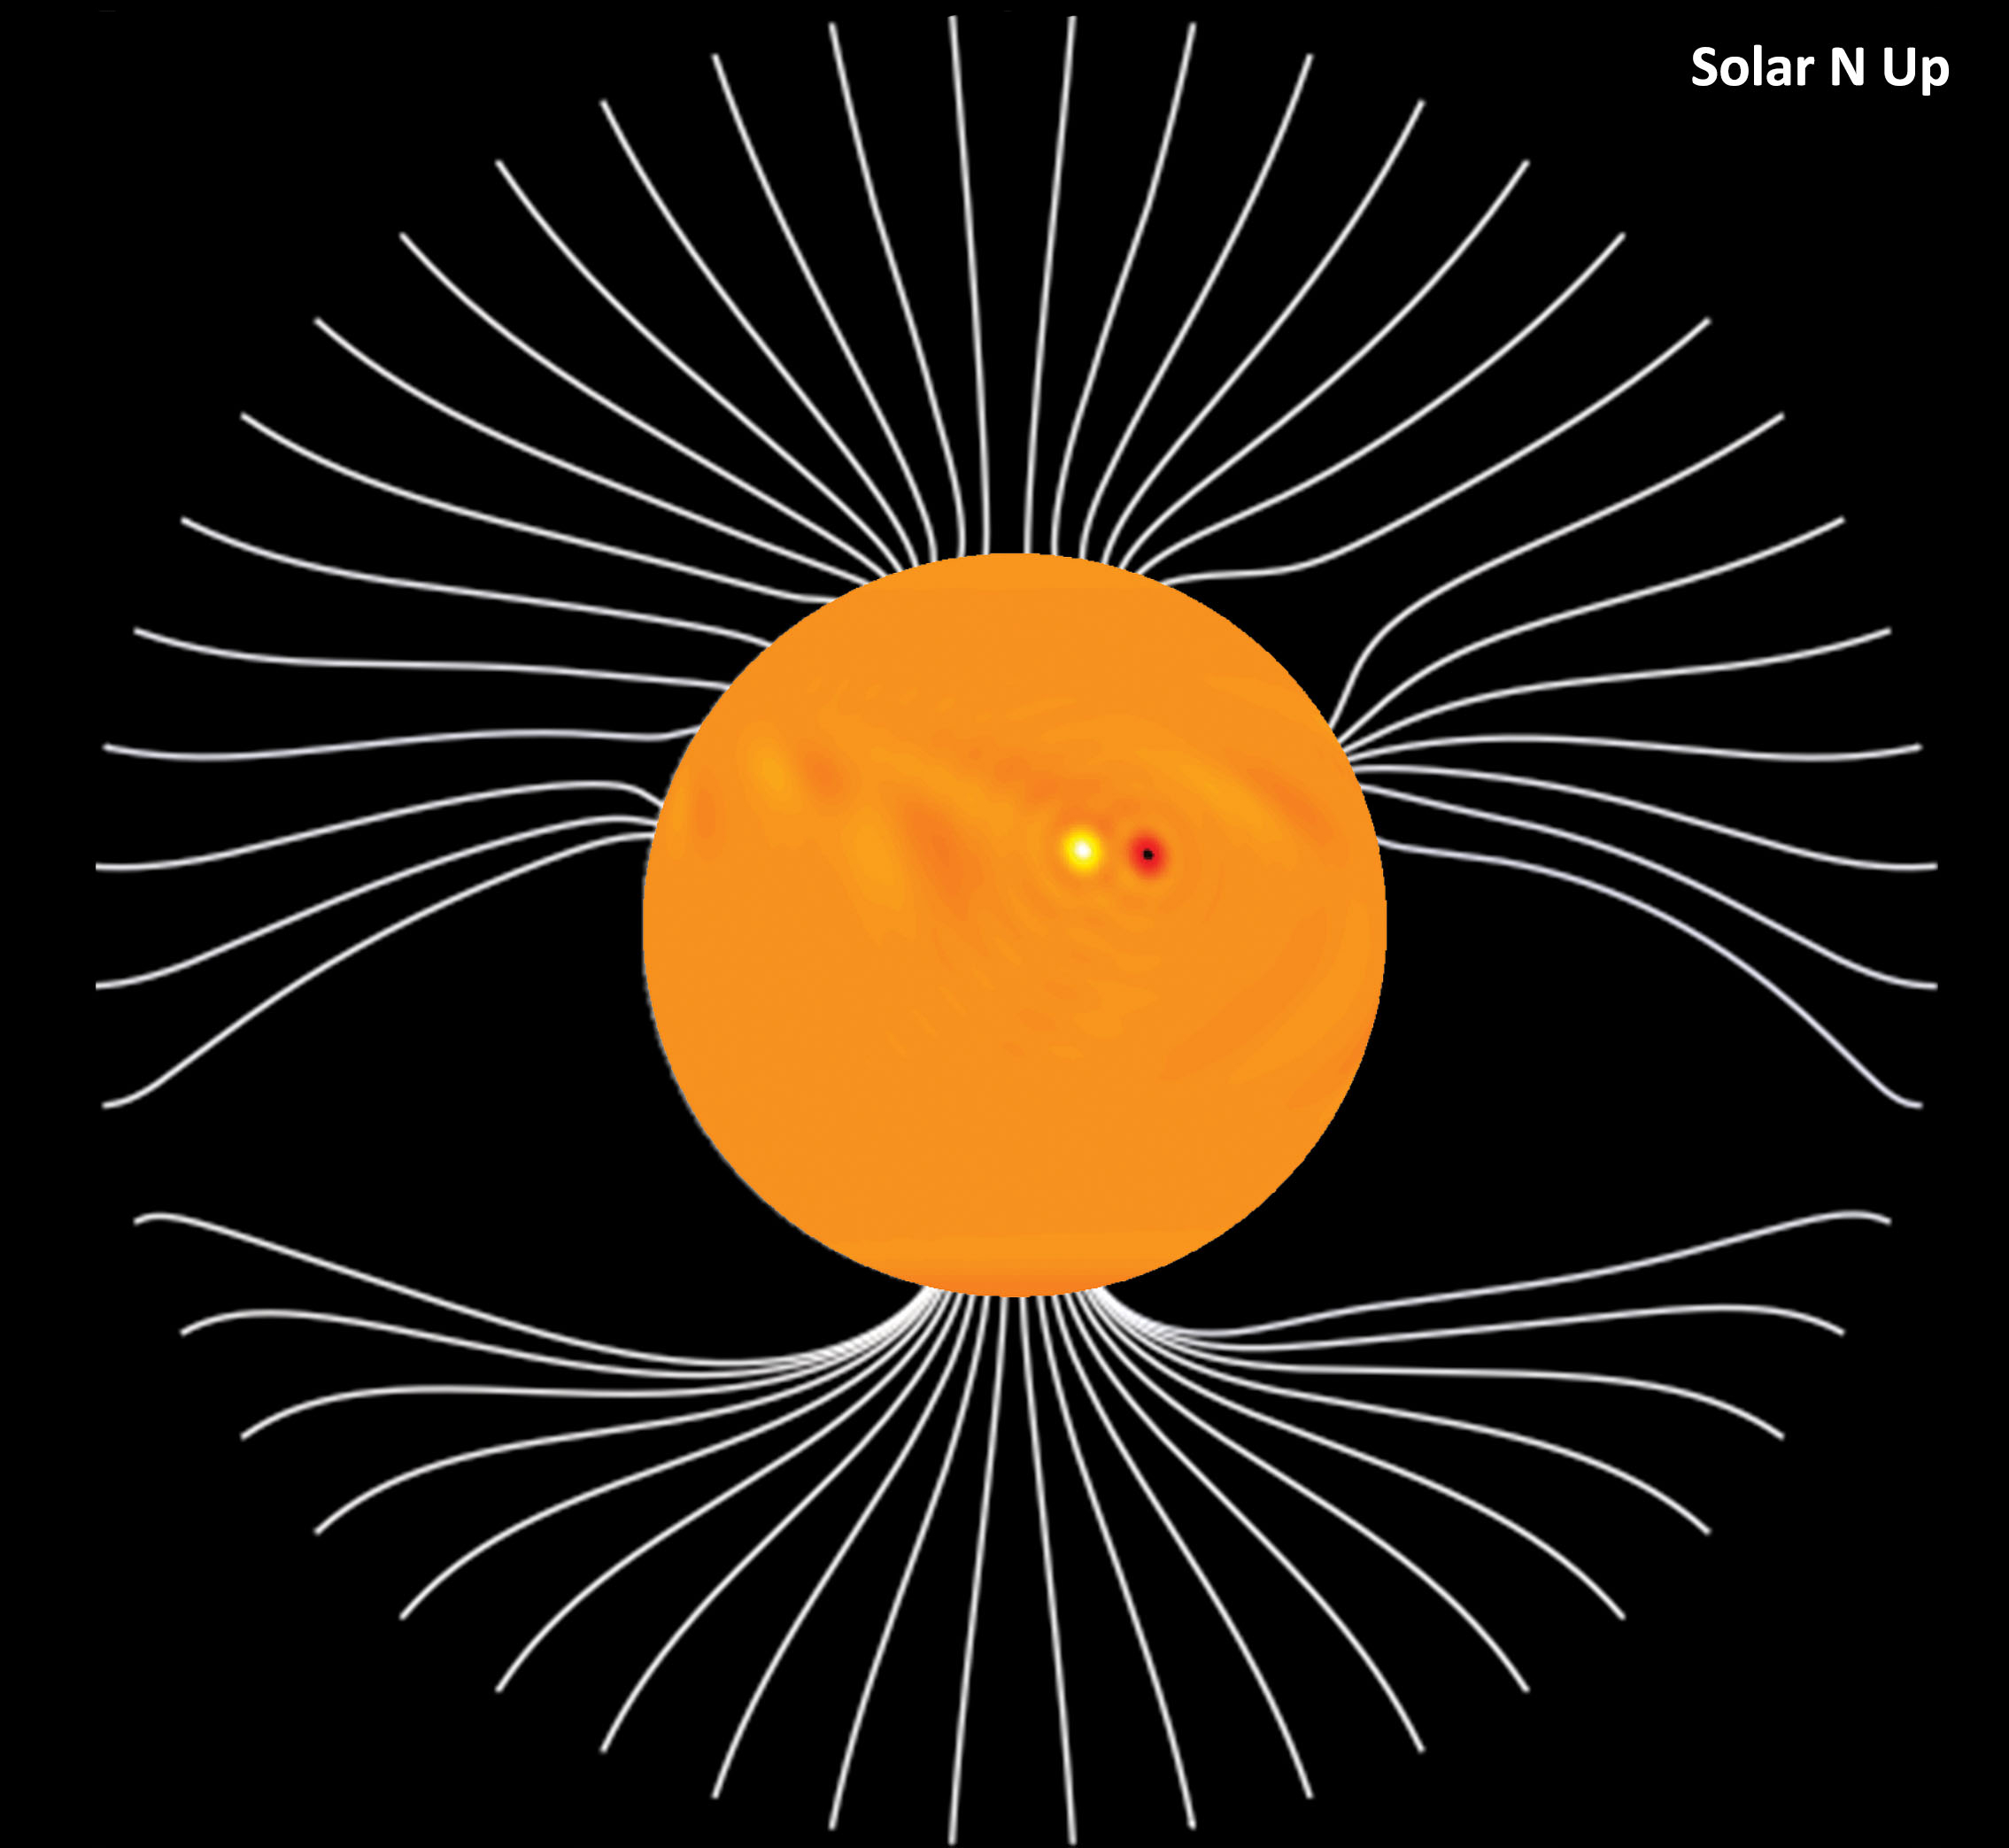
Updated Figure II(b) Center Inlay: Simulated surface field |
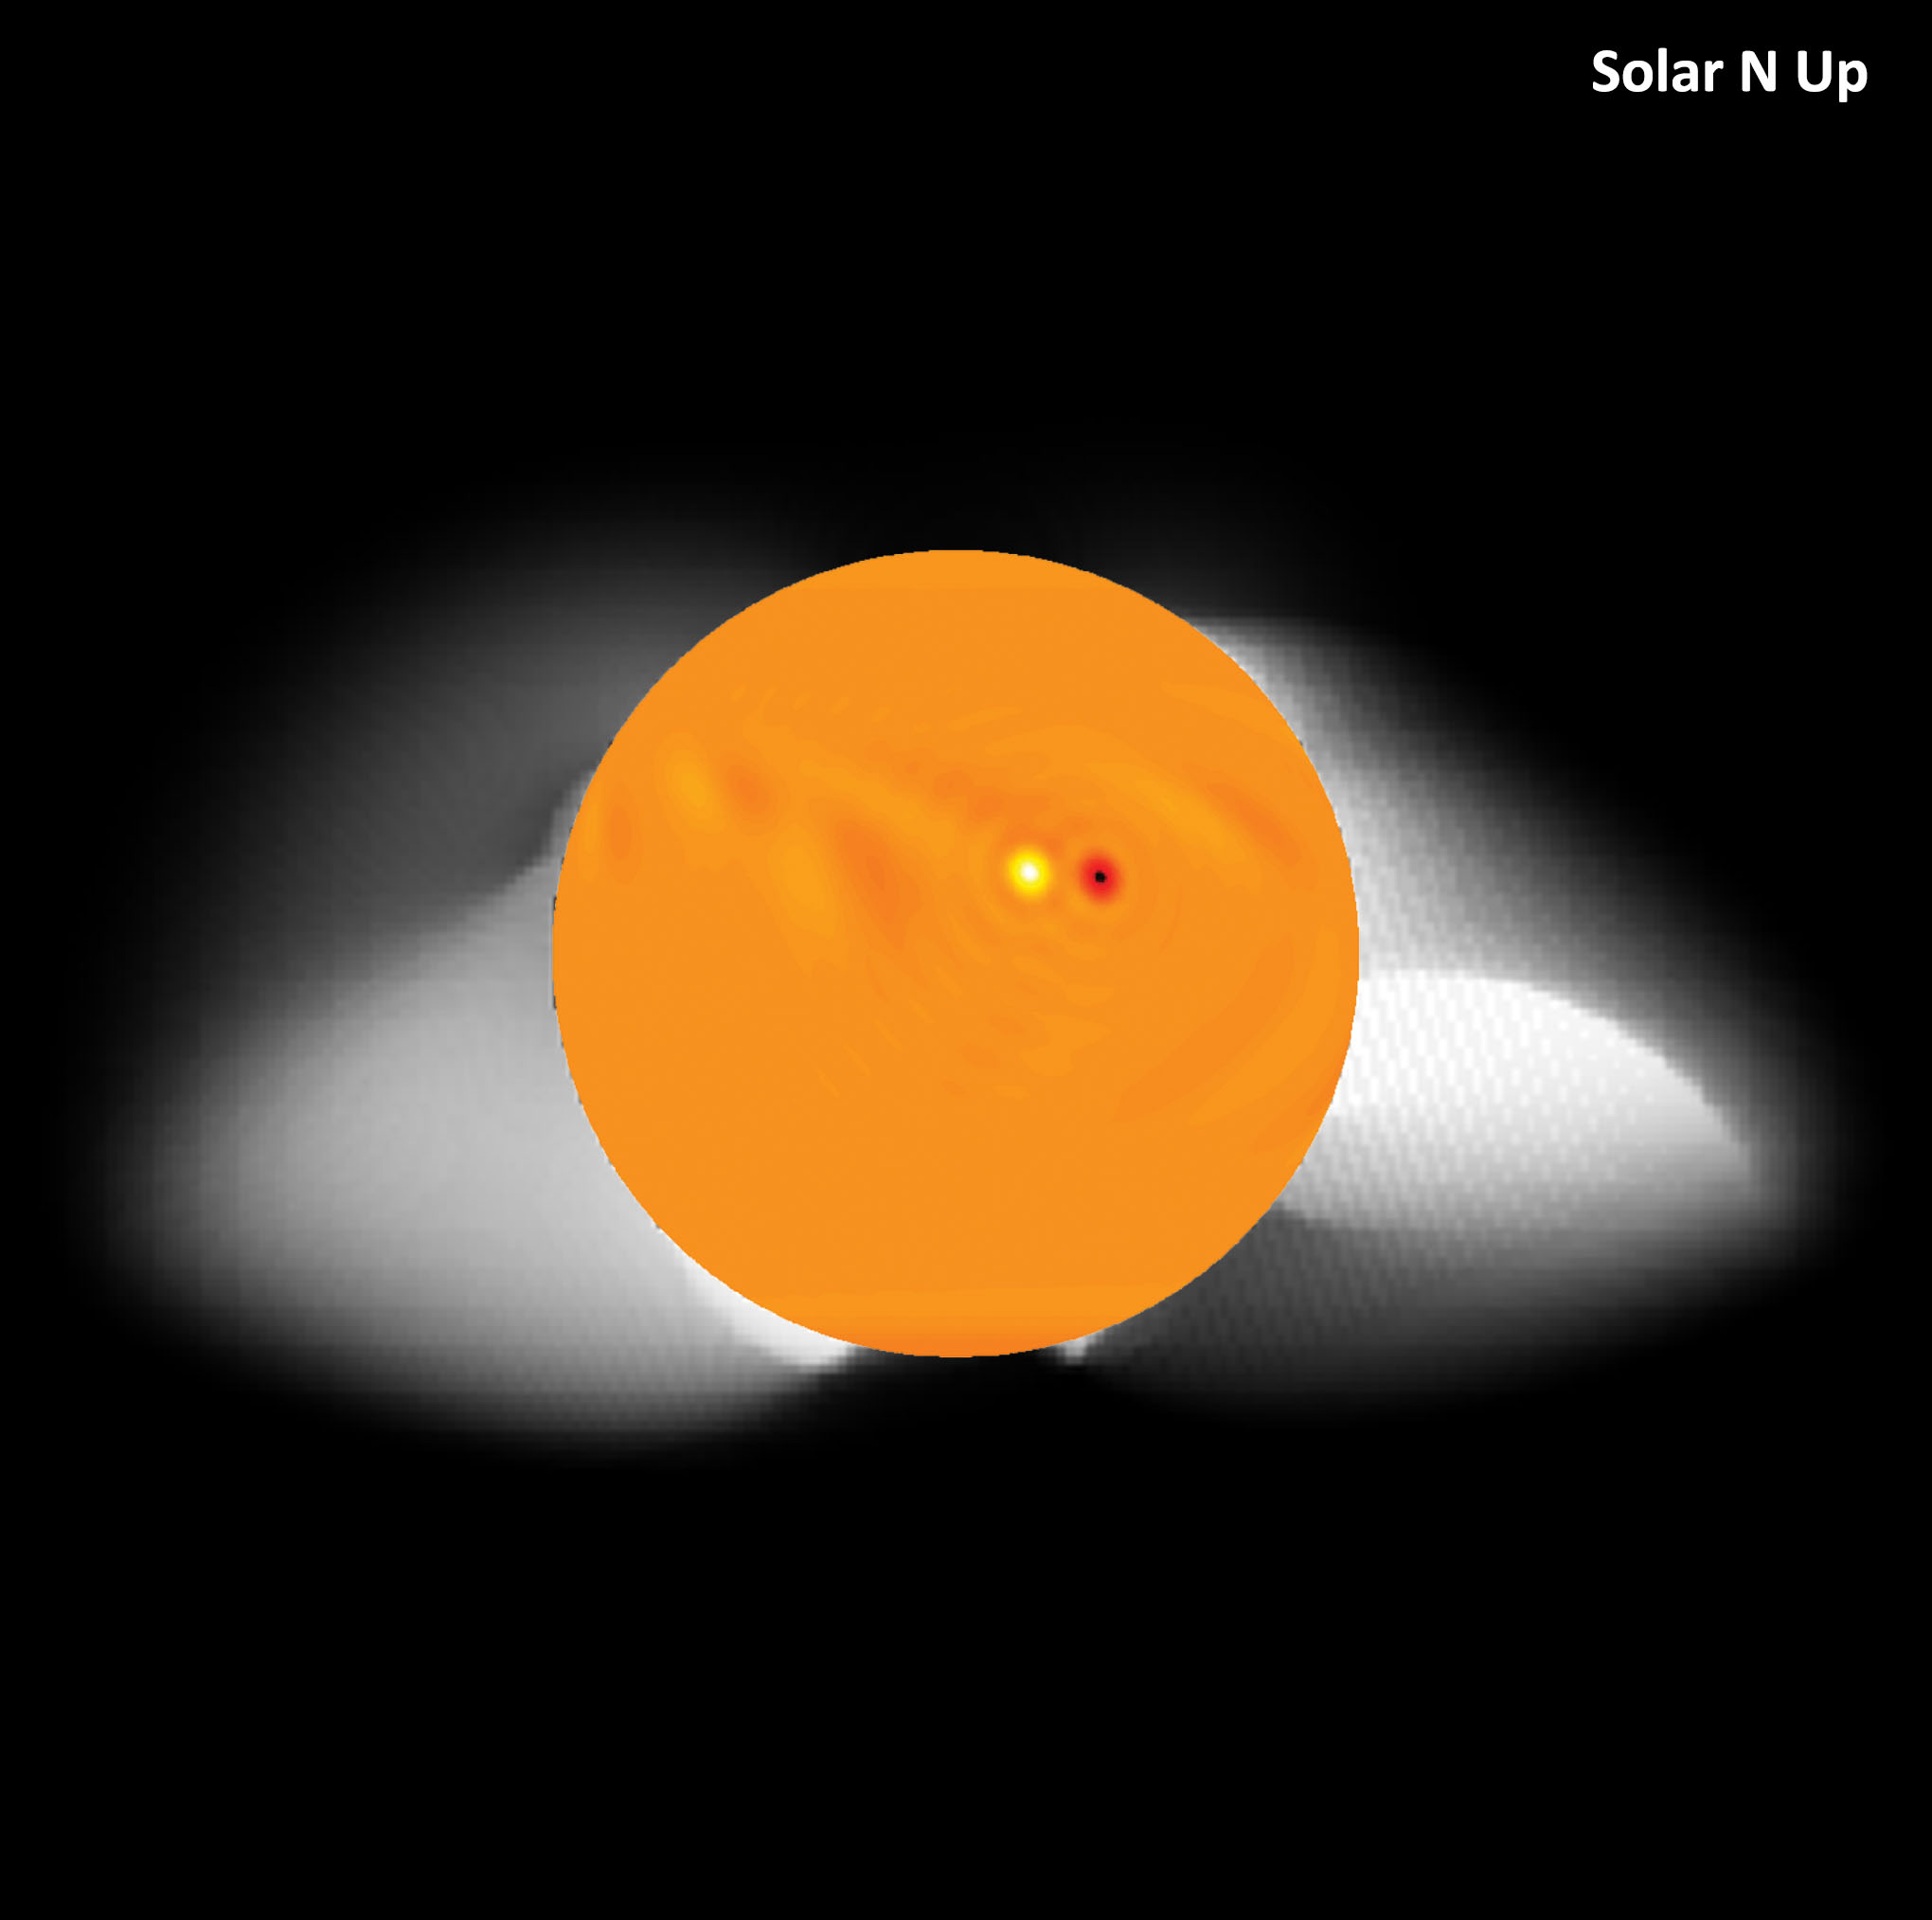
Updated Figure II(c) Center Inlay: Simulated surface field |
Below we are making available observational results that are coming in from the US and space satellites. Following this our prediction for the magnetic field structures in the solar corona is shown and quoted from our technical manuscript.
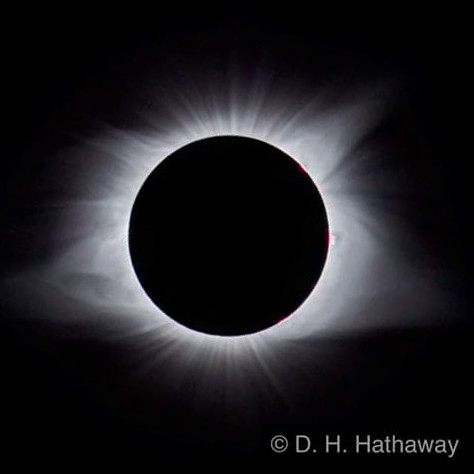
Figure I(a) Credit: David H. Hathaway |
Figure I(b) Source: MLSO K-Corona NGRF Image |
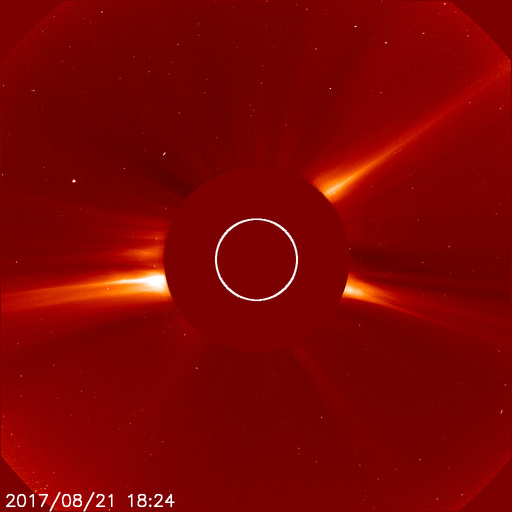
Figure I(c) Source: LASCO C2 Image |
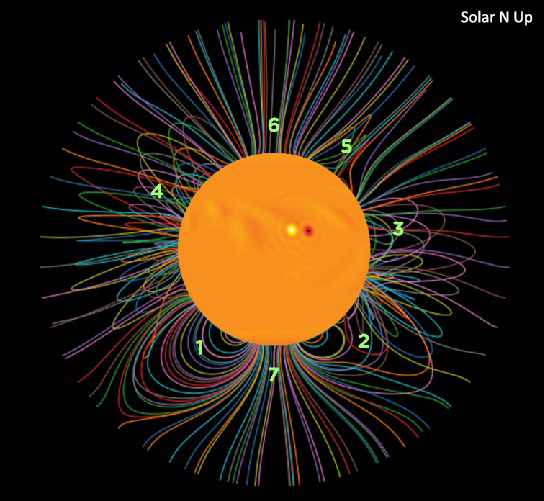
Figure II(a) Center Inlay: Simulated surface field |
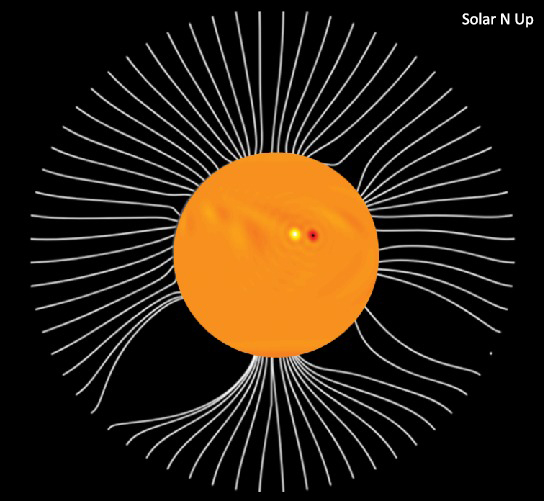
Figure II(b) Center Inlay: Simulated surface field |
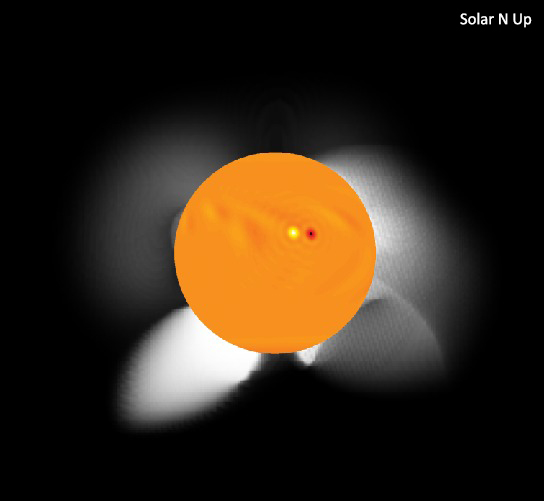
Figure II(c) Center Inlay: Simulated surface field |
"This surface magnetic field distribution is then utilized as an input in a PFSS model to extrapolate the coronal structure of the global Sun (Figure II (a,b,c)), as expected on 21 August, 2017. The inferred coronal magnetic field structure is our primary and most important prediction and is shown in Figure II (a). Only the open field lines reaching up to the source surface is rendered in Figure II (b). A synthetic coronal white light map reconstructed using an algorithm that provides more weight (i.e., intensity) to higher density closed field lines (but without any height dependence) is depicted in Figure II (c). Based on these simulated coronal structure, we predict the existence of two helmet streamers in the mid-latitude southern solar hemisphere, one each in the East and West limb. Their locations are marked as 1 and 2 in Figure II (a). A third possible streamer structure (much more confined and narrow) is located in the West limb northern hemisphere (location 5). As can be seen from Figure II (a), these structures represent regions of closed magnetic field lines overlying the solar surface. In Figure II (b) these helmet streamer structures are missing because we render only the open field lines and in Figure II (c) they appear as bright petal-like structures with pointed tips. Regions marked as 3 and 4, in the northern hemisphere West and East limb, respectively, are latitudinally extended low-lying closed magnetic field structures. These appear as somewhat flattened, large-scale diffuse bright regions in the synthetic corona rendition in Figure II (c). A comparison of the radially open magnetic field lines (which emanate from unipolar patches) from the North and South poles clearly show that the South pole has more densely packed field lines. This implies that the polar flux in the South pole is stronger relative to the North pole and is indicative that the sunspot cycle 25 will be asymmetric, with stronger sunspot activity in the southern hemisphere.
In the synthetic corona generated using our algorithm, the two helmet streamers in the South are clearly discernable. In the North, the narrow streamer-like structure on the West limb is not clearly distinguishable from the low-lying diffuse structure nearby (but may potentially be observable further out from the Sun). The coronal region overlying the northern hemisphere East limb is relatively less active compared to the others."
In what is being dubbed as the great American solar eclipse, on 21 August 2017, a total solar eclipse will sweep across the continental United States. Given the path of the eclipse and the length of totality available for eclipse observations, this eclipse will offer unprecedented opportunities for observations of the Sun's coronal structure and diagnostics of the coronal magnetic field. The Sun's coronal magnetic field is notoriously difficult to constrain and theoretical computational models must be relied upon for gaining insight on the coronal structure. These models are crucial to understanding the coronal heating problem (i.e., the enigma of the million degree solar corona) and to explore the origins of, and predict the occurence of solar storms that create severe space weather. Space weather impacts our modern day technologies ranging from satellitte operations, telecommunications, GPS navigational networks and electric power grids.
To predict and infer the structure of the coronal field expected during the eclipse, we use a data driven solar surface flux transport model (with in-built memory over multiple years). This computational model is forward run to 21 August 2017 to predict the Sun's surface field distribution (assuming no new emergence of Sunspots after 16 August 2017). The predicted surface field distribution on 21 August 2017 is subsequently used as input in a potential field source surface model of the corona to generate the coronal structures.
This technique is complementary to numerically more expensive, full magnetohydrodynamic simulations, based on which a prediction of the coronal structure has recently been made by Predictive Sciences Inc. (see link below). While the full MHD simulations are better at capturing low-latitude, highly twisted non-potential structures, the technique we have employed can potentially render more accurate high latitude structures.
In the description of our prediction below, the solar West and East limbs denote the right and left limbs, respectively, as viewed from Earth.
Our prediction for the 21 August 2017 eclipse (encapsulated in Figures 1, 2, 3 and 4) indicates the presence of two prominent helmet streamers (i.e., petal-like closed magnetic field structures with pointed tips), one each in the Eastern and Western limb on the southern solar hemisphere and more diffused, low-lying, closed magnetic field structures with larger latitudinal spread on both the limbs in the northern hemisphere, of which the one in the West is more prominent. A third possible helmet streamer which is quite narrow is seen in the West in the northern hemisphere. The latter is not easily distinguishable from the nearby diffuse structure in the synthetic white light corona, but may be more prominent further out from the Sun. We also find significant radial open-flux at the polar regions indicating the accumulation of unipolar magnetic fields in the build-up to the minimum of Sunspot cycle 24. This polar field build up is seen to be more intense (i.e., having higher density of field lines) in the south pole of the Sun. The strongly magnetic South pole of the Sun is indicative of an asymmetric sunspot cycle 25 with stronger activity in the southern hemisphere.
An independent prediction of the coronal structure by Predictive Sciences Inc. (USA), the only other group to the best of our knowledge to have predicted the coronal structure of the upcoming solar eclipse, and who have a long and distinguished tradition of such predictions, can be found here:
http://www.predsci.com/corona/aug2017eclipse/home.php
PREDICTION TEAM
Dibyendu Nandi*, CESSI and Department of Physical Sciences, IISER Kolkata, India
Prantika Bhowmik, CESSI, IISER Kolkata, India
Anthony R. Yeates, Department of Mathematical Sciences, Durham University, UK
Suman Panda, CESSI and Department of Physical Sciences, IISER Kolkata
Rajashik Tarafder, CESSI, IISER Kolkata
Soumyaranjan Dash, CESSI, IISER Kolkata
*Dibyendu Nandi is an Associate of the Inter-University Centre for Astronomy and Astrophysics (Pune)
We wish clear skies to our American colleagues!
POINT OF CONTACT
Dibyendu Nandi: dnandi @ iiserkol . ac . in
ACKNOWLEDGEMENTS
This eclipse prediction campaign was conceived and led by Dibyendu Nandi at CESSI - a multi-institutional Center of Excellence established and funded by the Ministry of Human Resource Development, Government of India. P.B. acknowledges funding by the Indo-French Center for the Promotion of Advanced Research/CEFIPRA through grant 5004-1. S.D. acknowledges DST-INSPIRE Program of the Govt. of India. D.N. and A.R.Y. acknowledge the NASA Heliophysics Grand Challenge Grant NNX14AO83G for facilitating their interactions. We acknowledge utilization of data from the NASA/SDO HMI instrument maintained by the HMI team and the Royal Greenwich Observatory/USAF-NOAA active region database compiled by David H. Hathaway. We are grateful to Prosenjit Lahiri and Nabamita Das of CESSI for helping with non-technical visualization support and the design of this website.
THE 21 AUGUST 2017 GREAT AMERICAN SOLAR ECLIPSE
The solar eclipse which will occur on 21 August 2017 will be the first total solar eclipse visible across the entire contiguous United States since 8 June 1918. This event has generated immense interest among scientists and the general public alike. The event begins at 9:06 AM PDT (4:06 PM UTC) at the Oregon coast and ends at the South Carolina coast at 4:06 PM EDT (8:06 PM UTC). The path of totality is expected to cover 16% of the US during this period. The longest duration of totality is expected to be 2 minutes 41.6 seconds at Carbondale, Illinois. For about 30 seconds before and after totality, shadow bands may be observed over bright uniform surfaces. Keen observers may be able to catch a short glimpse of the Sun's chromosphere in the form of a reddish outline.
For further details and maps of path of totality, refer to:
https://eclipse2017.nasa.gov/
WHY DID WE EVEN BOTHER TO PREDICT AN ECLIPSE WE WILL NOT GET TO SEE IN INDIA AND UK?
A total solar eclipse offers the best chance for ground-based coronal observations that can constrain theories and models of the Sun's corona. These models are essential in understanding the physics of coronal dynamics and the origin of solar storms. It is with the aim to understand the Sun's corona that scientists chase solar eclipses across countries and continents with their instruments. And it is with this same aim that theorists and modelers like us recreate the magic of the Sun using physics and computers. We will not get to see the eclipse, but we hope that our model prediction and the simulated data will on the one hand aid in interpreting the observations of the eclipse made by our American colleagues, and on the other hand, the eclipse observations by our American colleagues will teach us what we did right, and what we did wrong so that we can do better.
Science sans frontiers!
A BRIEF HISTORY OF SOLAR ECLIPSES
Eclipses have long been the subject of fantasies for humankind in its bid to understand the heavens. Interest in this phenomenon can be traced back to as early as 3340 BC in Ireland where petroglyphs exhibit a consistent understanding of tracks of the Sun and Moon. Further records are obtained around 2134 BC in China where early philosophers recorded the event describing it as "an inharmonious meeting of the Sun and the Moon". Descriptions of transitions in colors during solar eclipses have been recorded in ancient Indian texts such as Pancavimsa Brahmana. These vividly described color transitions match modern descriptions of solar eclipses. By 500 BC, the Babylonian and Greeks had already developed crude methods to predict the time of solar eclipses. However, the mysticism around eclipses remained till much into the middle ages. Confirmation bias fed to the belief that eclipses portended the death of emperors.
This mysticism, however, proved to be a windfall for astronomy as emperors concerned by this phenomena began to fund philosophers to study eclipses. It resulted in the first accurate sky maps and studies of the path of heavenly bodies. Around 130 BC, Hipparchus used observations of an eclipse from different locations to estimate the size of the Moon. In 1715, Halley used Newton's laws of gravity to predict the position and time of the next solar eclipse. Though Haley was slightly off, it cemented dominance of Newton's theories in English science. More attention came his way as his laws were used to calculate the trajectories of planets.
It was soon identified that the observations and calculations for the orbits of Mercury and Uranus slightly varied. A bid to explain Mercury's orbit would eventually lead Einstein to work out his revised theory of gravity. In a triumphant demonstration of the scientific method, the solar eclipse of 1919 would again help Arthur Eddington verify Einstein's Theory of General Relativity.
Total solar eclipses have historically provided us a unique opportunity to study the corona of the Sun. These observations are otherwise restricted due to the Sun's bright photosphere. Observations during eclipses have therefore been the tools to understand the magnetic structuring, dynamics and physical construct of the Sun's million degree corona.
Though the first reported reference of the corona can be traced back to Leo Diaconus of Constantinople in 968 AD, the first scientific ideas regarding the solar corona only emerged in the early 17th century. In 1605, Johannes Kepler suggested that the corona is light reflected due to the presence of material surrounding the Moon. In 1724, Jose Jaoquin coined the term 'Corona' and suggested that it is part of the Sun and not material surrounding the Moon. More than a century later, the first wet plate photographs of the Sun's corona were obtained in 1860 during a total solar eclipse. Currently, state of the art telescopes use occulting disks to create artificial eclipses to observe the solar corona.
Coronal magnetic field dynamics lead to solar magnetic storms (flares and CMEs) which hurl vast amounts of magnetized plasma (charged particles) in to interplanetary space creating hazardous space weather. Space weather impacts many of the technologies that we rely on today, including telecommunications, GPS navigational networks, electric power grids, air-traffic on polar routes and satellite operations. Observations of the solar corona during eclipses has the potential to constrain theoretical and computational models of coronal magnetic fields, which are expected to yield better forecasting capabilities for destructive space storms. These observations can also constrain the physical processes that heat the Sun's corona to a super-hot million degrees and make it glow when the disk is shrouded by the dark side of the Moon.
The above compilation of historical facts, anecdotes and scientific information has been collected from various sources which are referenced below.
1. Website for Paul Griffin: http://www.astronomy.ca/3340eclipse/
2. Website: https://Sunearthday.nasa.gov/2006/locations/babylon.php
3. Website: http://www.astro.cornell.edu/academics/courses/astro201/hipparchus.htm
4. Pasachoff, J. M. (1999), "Halley and his maps of the Total Eclipses of 1715 and 1724" Journal of Astronomical History and Heritage' (ISSN 1440-2807), Vol. 2, No. 1, p. 39-54
5. Dyson, Frank W., Arthur S. Eddington, and Charles Davidson. "A determination of the deflection of light by the Sun's gravitational field, from observations made at the total eclipse of May 29, 1919". Philosophical Transactions of" the Royal Society of London A: Mathematical, Physical and Engineering Sciences 220.571-581 (1920): 291-333.
6. Totality - Eclipses of the Sun (3rd edition) by Littmann, Espenak, and Willcox
7. "Images and Astronomy" by Kirit J. Sheth
8. Website:- https://umbra.nascom.nasa.gov/spartan/coronagraphs.html
9. "Solar storm risk to the north American electric grid" - Llyod's, and Atmospheric and Environmental Research
10. Website: http://www.astronomeer.com/eclipses/index.html
11. Schrijver, C.J. et al. (2015), "Understanding Space Weather to Shield Society: A Global Roadmap for 2015-2025 Commissioned by COSPAR and ILWS", Advances in Space Research, Vol. 55, Page 2745
12. Vahia, M.N., and Subbarayappa, B.V. (2011), Eclipses in Ancient India.
13. Subbarayappa, B V, 2008, Traditions of Astronomy in India and Jyotishshastrs, Centre for Studies of Civilizations, Vol IV part 4, Centre for Studies of Civilisations, Viva Books
IMAGE AND DATA SHARING
The images and data on this webpage are provided for the scientific comunity and public who fund our research. It is free to use and disseminate with due acknowledgements.